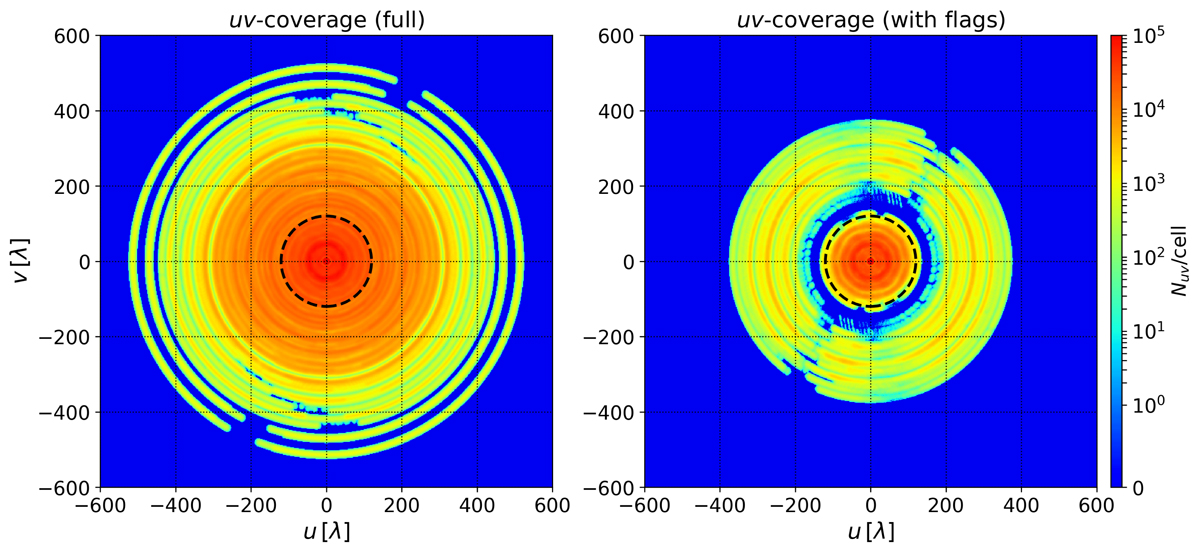
Fig. 2.
Download original image
Single sub-band (122 MHz) uv coverage of the A12-HBA array towards the NCP for 11 h of synthesis. Left panel: uv coverage of the full A12-HBA array. Right panel: same as on the left, but with flags included. The colour scale corresponds to the number of baselines in uv cells of size (δu, δv)=(1, 1) (in units of wavelength). The dotted black circle shows |u|=120, which is used as the baseline range to model the diffuse structure in later sections. The effect of flagging five stations is clearly visible in the uv coverage shown in the right panel.
Current usage metrics show cumulative count of Article Views (full-text article views including HTML views, PDF and ePub downloads, according to the available data) and Abstracts Views on Vision4Press platform.
Data correspond to usage on the plateform after 2015. The current usage metrics is available 48-96 hours after online publication and is updated daily on week days.
Initial download of the metrics may take a while.