Fig. 3
Download original image
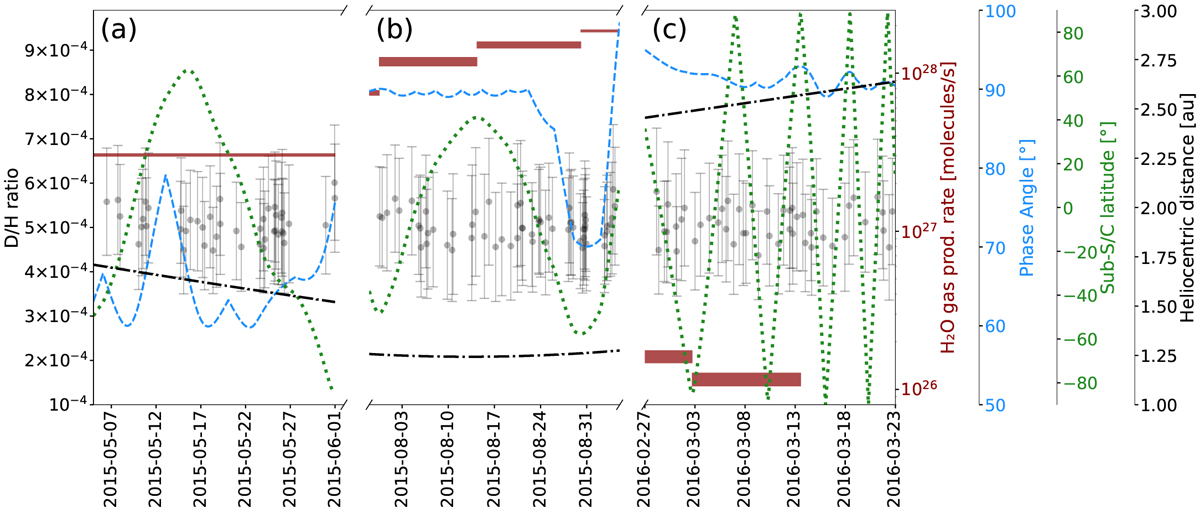
D/H in H2O during different mission phases compared to H2O gas production (Läuter et al. 2020, red), phase angle (blue), sub-S/C latitude (green) and heliocentric distance (black). Panel a: first equinox; Panel b: perihelion and peak gas production phase; Panel c: second equinox. The individual measurement uncertainties represent statistical errors from the count rates and errors from the fit.
Current usage metrics show cumulative count of Article Views (full-text article views including HTML views, PDF and ePub downloads, according to the available data) and Abstracts Views on Vision4Press platform.
Data correspond to usage on the plateform after 2015. The current usage metrics is available 48-96 hours after online publication and is updated daily on week days.
Initial download of the metrics may take a while.