Fig. 1
Download original image
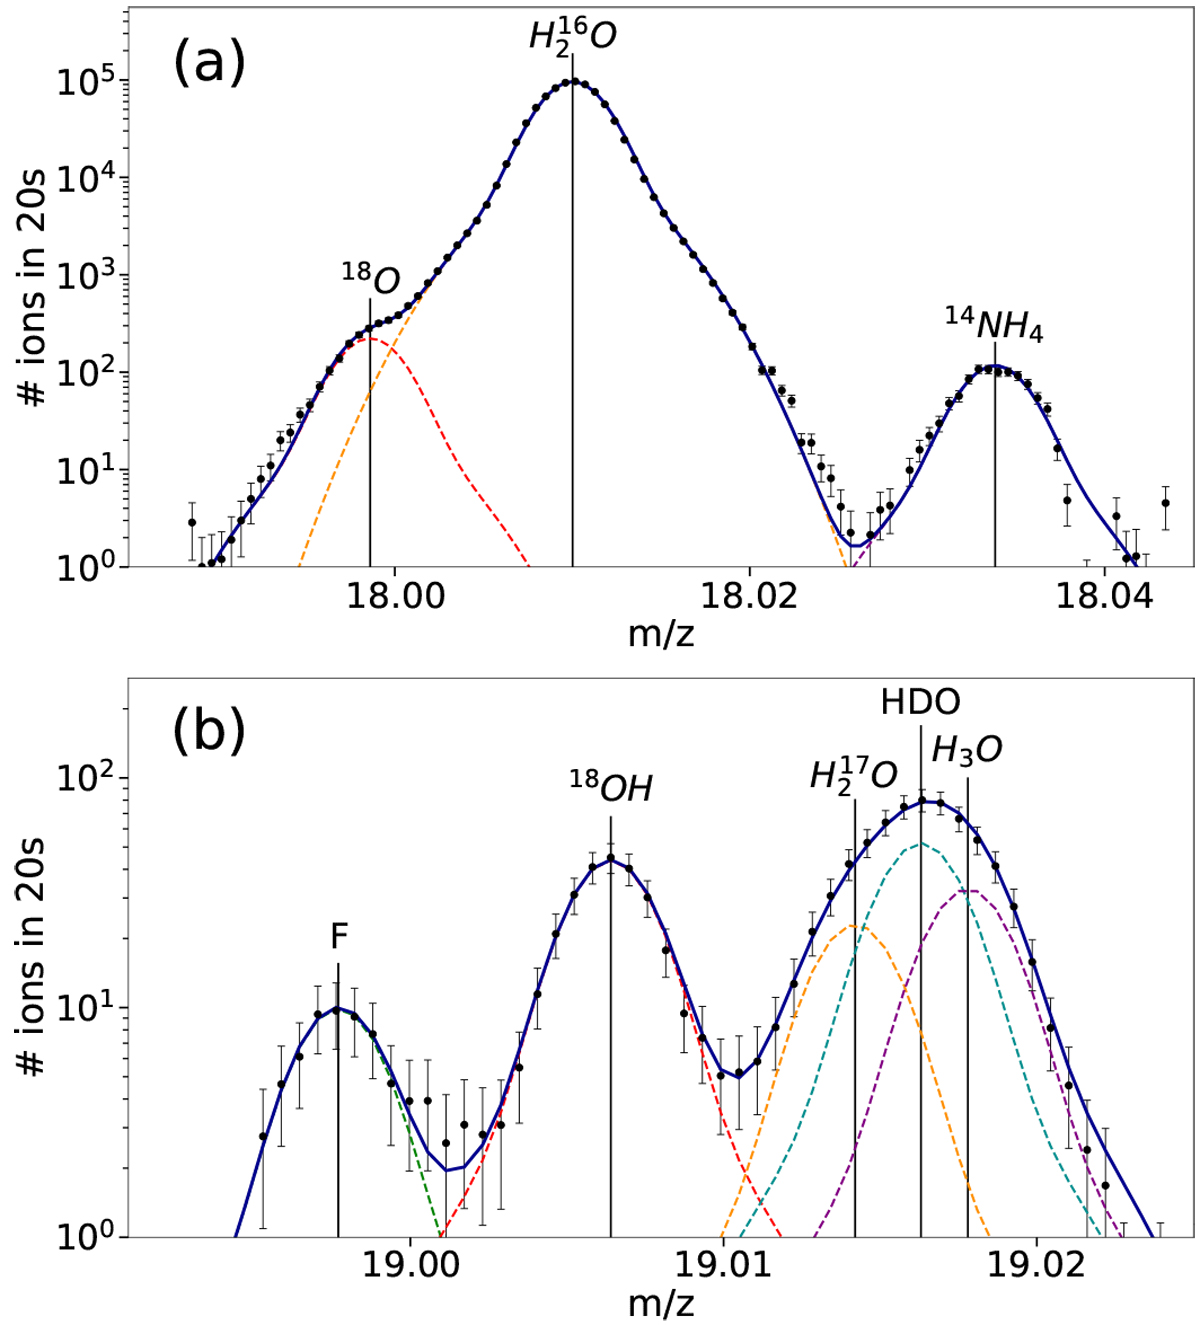
Sample mass spectra for m/z 18 and 19 displaying the signatures of the isotopologues of water. Panel a: m/z 18 from 2015-05-07 17:38 (UTC). Panel b: m/z 19 from 2015-05-26 01:35 (UTC). Measured data are represented by black dots including their statistical uncertainties. Individual mass fits and the total sum of the fits are shown with coloured lines.
Current usage metrics show cumulative count of Article Views (full-text article views including HTML views, PDF and ePub downloads, according to the available data) and Abstracts Views on Vision4Press platform.
Data correspond to usage on the plateform after 2015. The current usage metrics is available 48-96 hours after online publication and is updated daily on week days.
Initial download of the metrics may take a while.