Fig. 6
Download original image
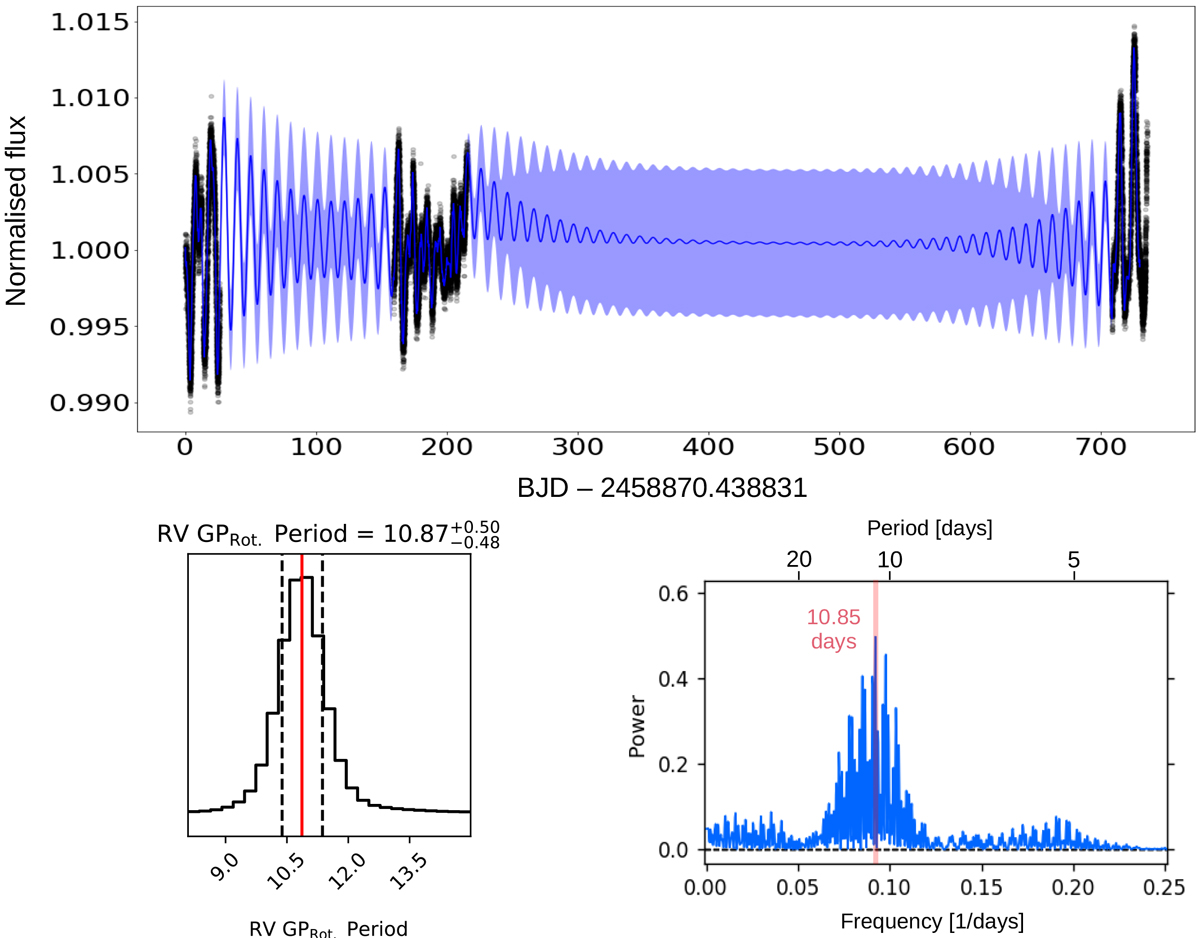
Final plots from the stellar rotation analysis described in the paper. Top: TESS data (black points) with the MAP model prediction. The blue line shows the predictive mean, and the blue contours show the predictive standard deviation. Bottom left: probability density of the rotation period. The period is the parameter Prot in Eq. (1). The mean value is indicated by the vertical red line and the 1σ error bar is indicated by the dashed black lines. Bottom right: GLS periodogram.
Current usage metrics show cumulative count of Article Views (full-text article views including HTML views, PDF and ePub downloads, according to the available data) and Abstracts Views on Vision4Press platform.
Data correspond to usage on the plateform after 2015. The current usage metrics is available 48-96 hours after online publication and is updated daily on week days.
Initial download of the metrics may take a while.