Free Access
Fig. 5
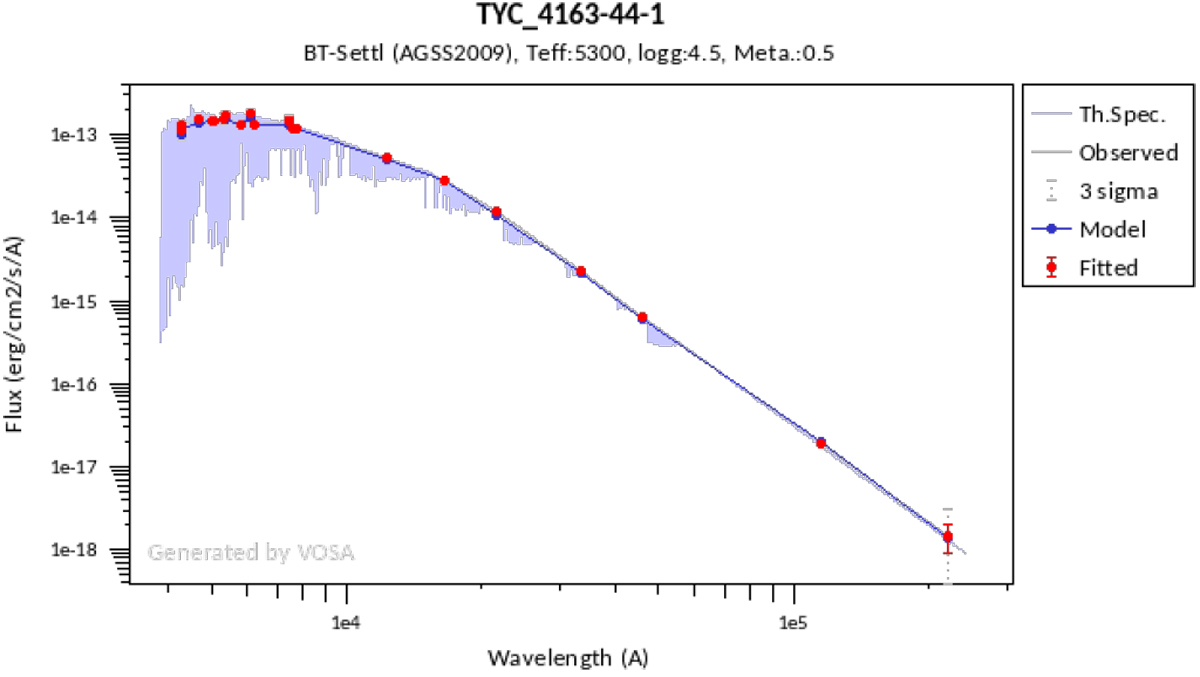
Download original image
Spectral energy distribution of TOI-1268. The red symbols represent the used photometric observations. The blue line represents the best model (BT-Settl-AGSS2009) from all different models used. The model spectrum is plotted in the background.
Current usage metrics show cumulative count of Article Views (full-text article views including HTML views, PDF and ePub downloads, according to the available data) and Abstracts Views on Vision4Press platform.
Data correspond to usage on the plateform after 2015. The current usage metrics is available 48-96 hours after online publication and is updated daily on week days.
Initial download of the metrics may take a while.