Fig. 2
Download original image
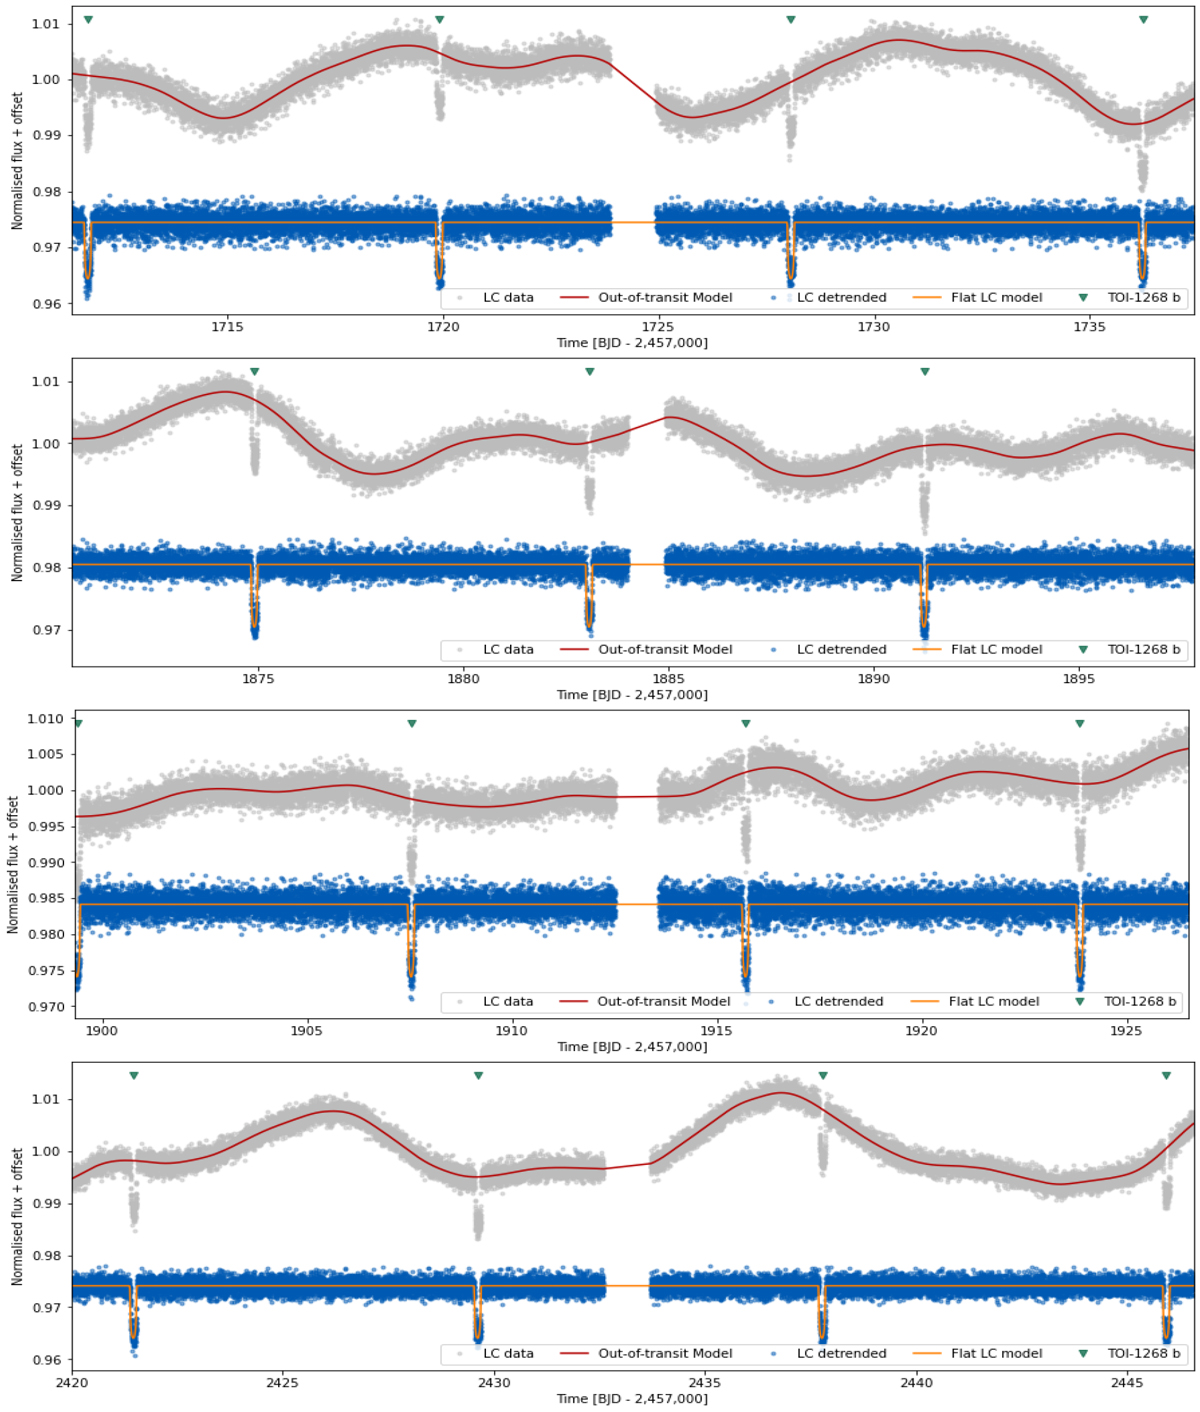
Light curves from TESS sectors for TOI-1268 created with lightkurve from TESS tpf files. Grey points correspond to TESS observations and red lines are out-of-transit GP models created with citlalicue following the variability in LCs. This model was subtracted leading to flattened TESS LCs (blue points) with transit model (orange lines). Green triangles show the positions of transits.
Current usage metrics show cumulative count of Article Views (full-text article views including HTML views, PDF and ePub downloads, according to the available data) and Abstracts Views on Vision4Press platform.
Data correspond to usage on the plateform after 2015. The current usage metrics is available 48-96 hours after online publication and is updated daily on week days.
Initial download of the metrics may take a while.