Fig. 14
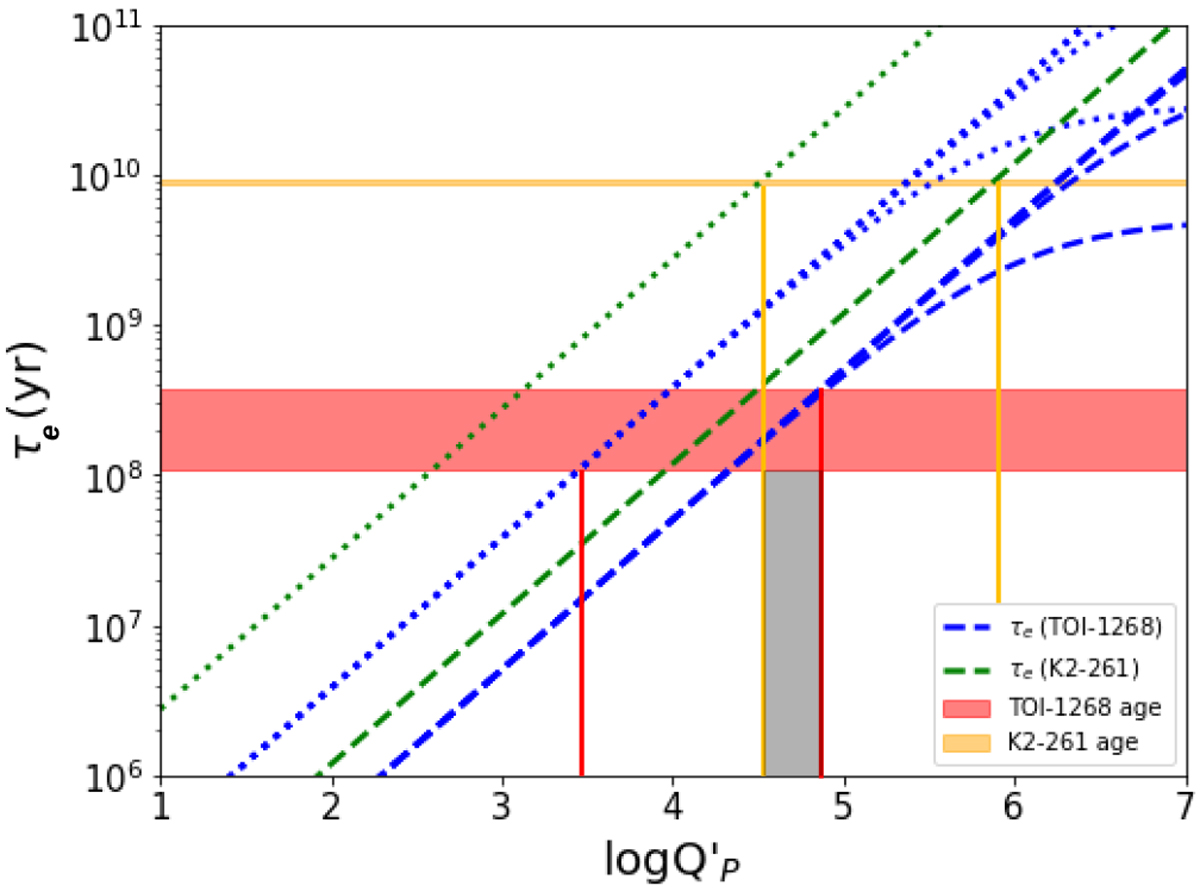
Download original image
Values of the tidal circularisation timescales as a function of planet tidal quality factor for TOI-1268b (blue lines) and K2-261 (green lines). The dashed and dotted lines of each colour represent the lower and upper boundaries of plausible values of timescales based on the parameter uncertainties used in Eq. (2). The curved blue lines represent the dependence on stellar tidal quality factors for Q′ = 104, 105, 106, 107, 108. They demonstrate that the stellar tidal quality factor influences the circularisation timescale only if the value of Q′p is larger than Q′ = 105.5. The horizontal lines show the system ages; the vertical lines give the values of Q′p in positions where timescales cross the ages of the systems. These positions define the lower limit for Q′p in the case of K2-261 and the upper limit in the case of TOI-1268. The grey region represents an overlap in Q′p between the lower limit and the upper limit.
Current usage metrics show cumulative count of Article Views (full-text article views including HTML views, PDF and ePub downloads, according to the available data) and Abstracts Views on Vision4Press platform.
Data correspond to usage on the plateform after 2015. The current usage metrics is available 48-96 hours after online publication and is updated daily on week days.
Initial download of the metrics may take a while.