Fig. 12
Download original image
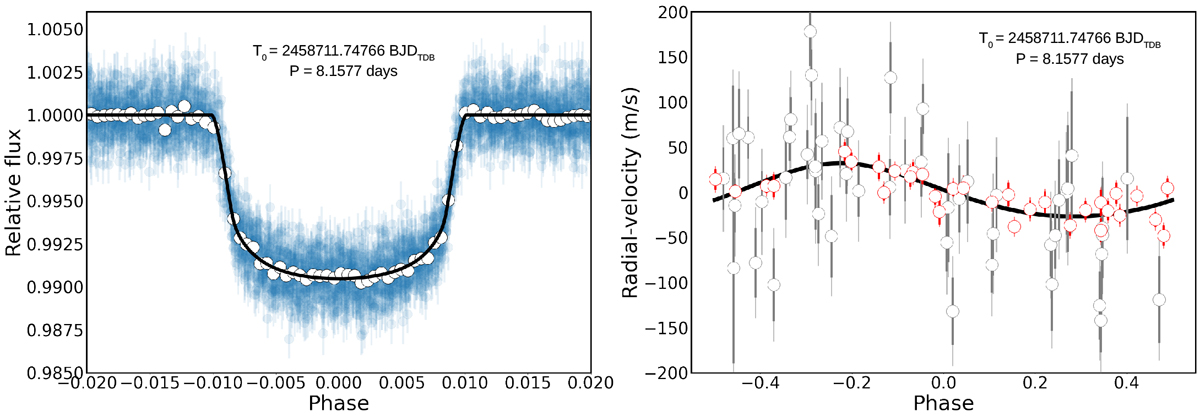
Final plots from the joint RV and transit modelling. Left: transit LC of the TOI-1268, fitted with juliet as part of the joint analysis described in Sect. 5.2. The blue points represent TESS data together with their uncertainties, and the white points are TESS binned data. The black line represents the best transit model. Right: orbital solution for TOI-1268 showing the juliet RV model in black. The grey points represent TCES data and the red points Tull data; also shown are their uncertainties and extra jitter term plotted with the lighter grey or red, respectively.
Current usage metrics show cumulative count of Article Views (full-text article views including HTML views, PDF and ePub downloads, according to the available data) and Abstracts Views on Vision4Press platform.
Data correspond to usage on the plateform after 2015. The current usage metrics is available 48-96 hours after online publication and is updated daily on week days.
Initial download of the metrics may take a while.