Fig. 9.
Download original image
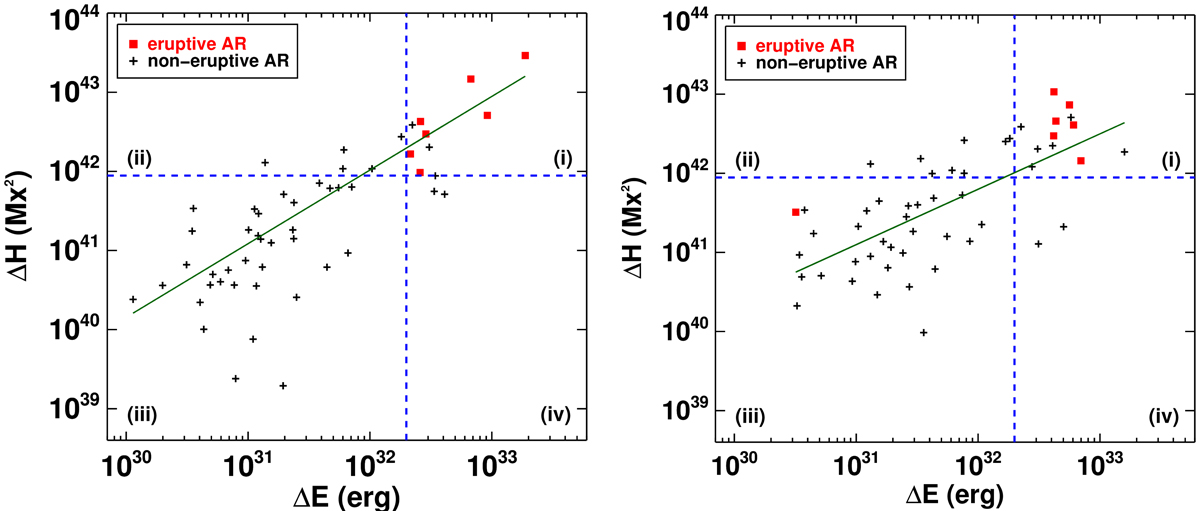
Scatter plots of the accumulated amounts of magnetic energy vs. absolute helicity during the flux emergence intervals of the ARs (left panel) and during the intervals from emergence start times until the ARs cross W45 or produce their first CME, whichever occurs first (right panel). The red squares and black crosses correspond to eruptive and noneruptive ARs, respectively. The blue dashed lines define the thresholds for magnetic helicity and energy above which ARs show a high probability to erupt. The green lines show the least-squares best logarithmic fits (Eqs. (4) and (5)).
Current usage metrics show cumulative count of Article Views (full-text article views including HTML views, PDF and ePub downloads, according to the available data) and Abstracts Views on Vision4Press platform.
Data correspond to usage on the plateform after 2015. The current usage metrics is available 48-96 hours after online publication and is updated daily on week days.
Initial download of the metrics may take a while.