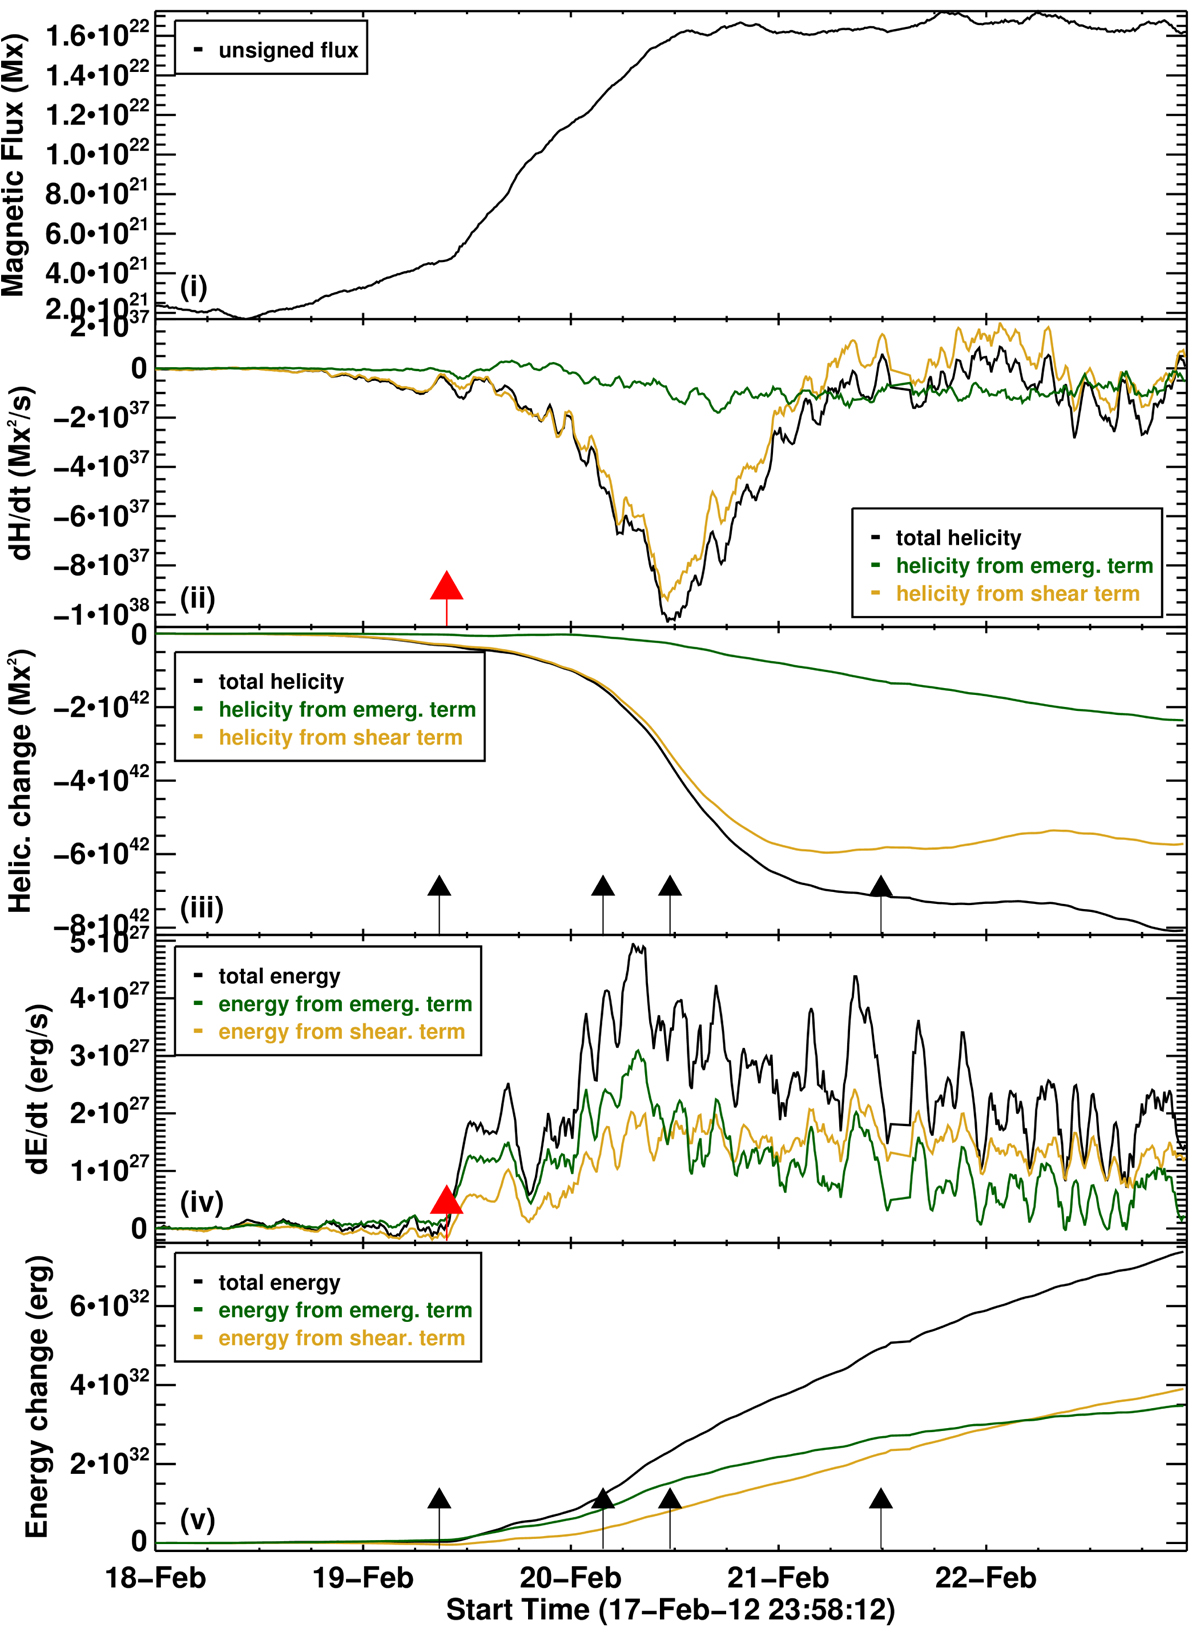
Fig. 5.
Download original image
Time profiles of the magnetic flux, helicity, and energy for eruptive AR 11422. (i) Time evolution of the unsigned magnetic flux of eruptive AR 11422. (ii) Time profile of the helicity injection rate, dH/dt (black). The gold and green curves represent the shear and emergence terms, respectively. (iii) The corresponding time profiles of accumulated helicity, ΔH(t). (iv) Same as panel (ii), but for the magnetic energy injection rate, dE/dt. (v) Same as panel (iii), but for the accumulated energy, ΔE. The red and black arrows indicate the start time of the CME and flares above C1.0, respectively, that occurred in the AR. The curves of both dH/dt and dE/dt are 48 min averages of the actual curves.
Current usage metrics show cumulative count of Article Views (full-text article views including HTML views, PDF and ePub downloads, according to the available data) and Abstracts Views on Vision4Press platform.
Data correspond to usage on the plateform after 2015. The current usage metrics is available 48-96 hours after online publication and is updated daily on week days.
Initial download of the metrics may take a while.