Fig. 11.
Download original image
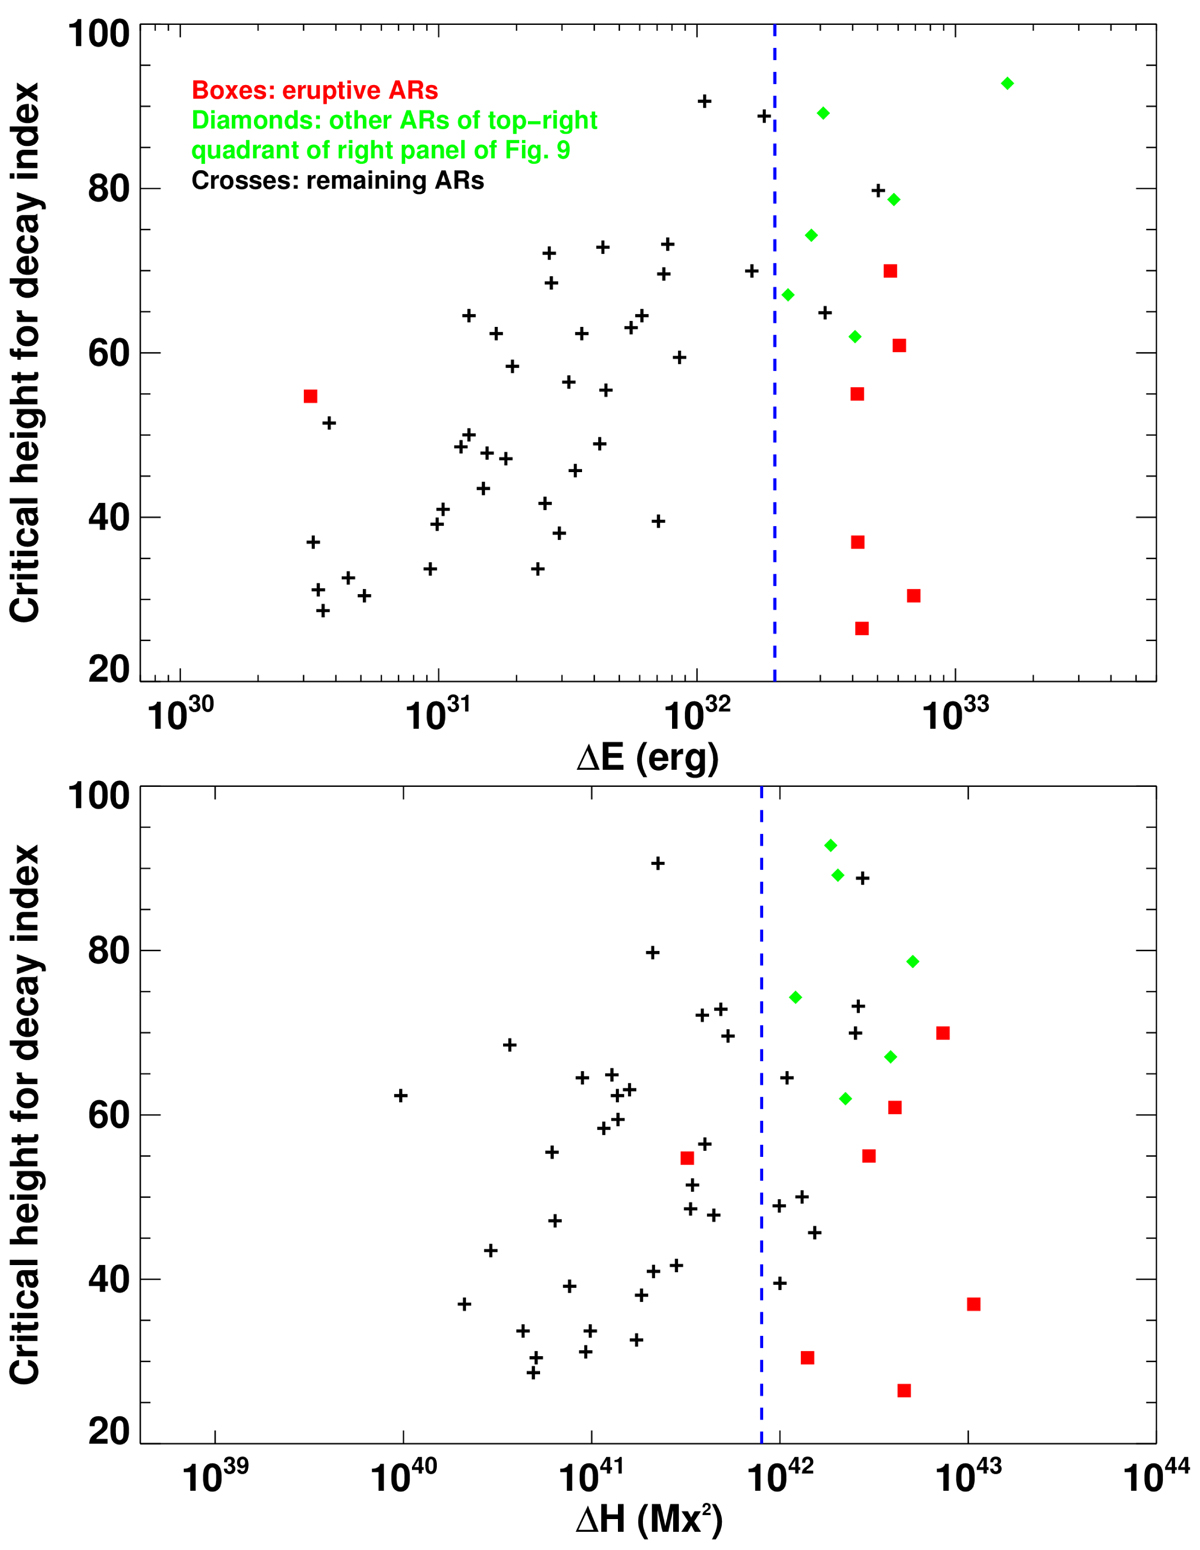
Scatter plots of accumulated magnetic energy and helicity vs. critical height for decay index. Top: accumulated magnetic energy from emergence start times until the ARs produce their first CME or cross W45, whichever occurs first, vs. height at which the decay index that has been calculated at the end of the intervals that were used to determine the magnetic energy budgets, reaches a value of 1.5. Red boxes denote eruptive ARs, and green diamonds denote the noneruptive ARs that appear in region (i) in right panel of Fig. 9. All other ARs are marked by crosses. Bottom panel: same as the top panel, but for the magnetic helicity instead of the magnetic energy.
Current usage metrics show cumulative count of Article Views (full-text article views including HTML views, PDF and ePub downloads, according to the available data) and Abstracts Views on Vision4Press platform.
Data correspond to usage on the plateform after 2015. The current usage metrics is available 48-96 hours after online publication and is updated daily on week days.
Initial download of the metrics may take a while.