Fig. 5
Download original image
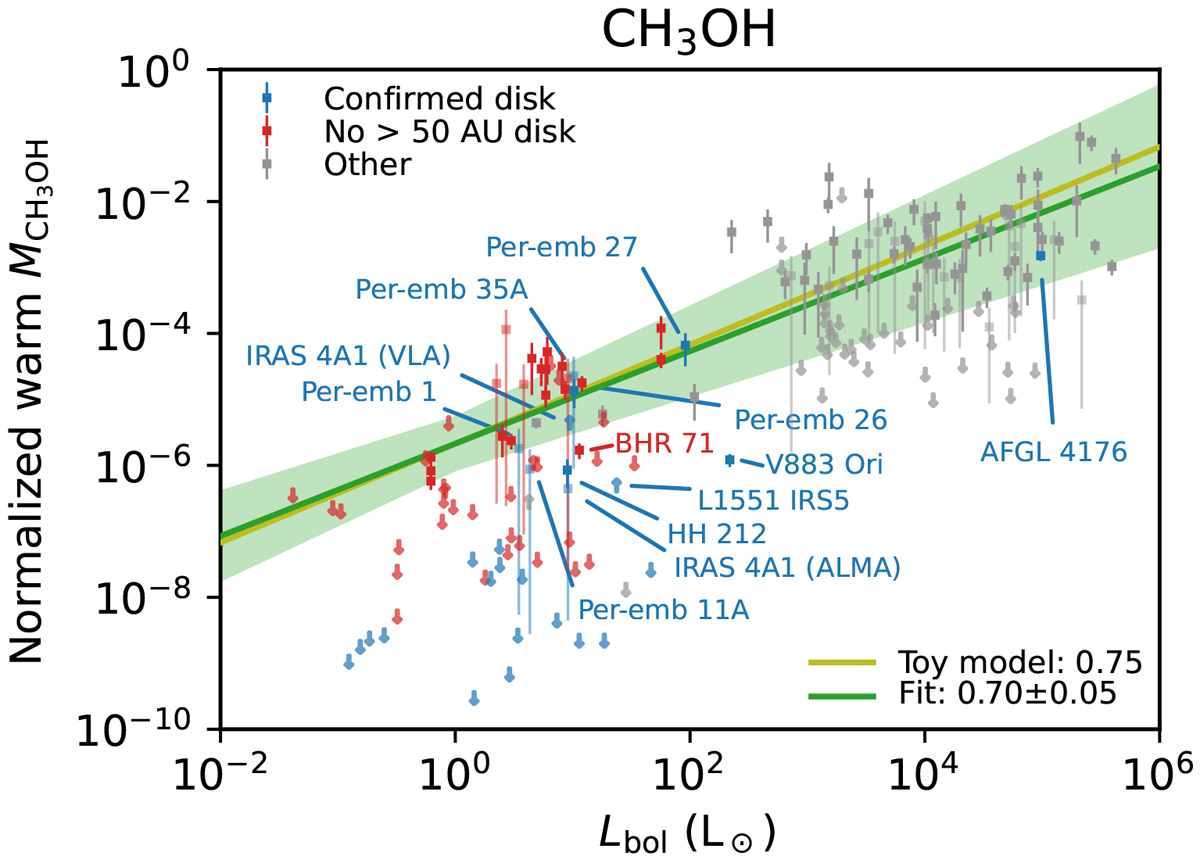
Normalized warm gaseous CH3OH mass with respect to Mdust within a 200 au radius as a function of the bolometric luminosity. Sources around which a disk has been detected on >10 au scales are indicated in blue, and sources where no disk is confirmed on >50 au scales are indicated in red. All other sources (i.e., with no information about a disk) are shown in gray. The green line indicates the best-fit power-law model to the data points (excluding the upper limits) and the green shaded area the 3σ uncertainty on the fit. The yellow line indicates the relation for the toy model of Eq. (4) scaled to match the best-fit power-law model.
Current usage metrics show cumulative count of Article Views (full-text article views including HTML views, PDF and ePub downloads, according to the available data) and Abstracts Views on Vision4Press platform.
Data correspond to usage on the plateform after 2015. The current usage metrics is available 48-96 hours after online publication and is updated daily on week days.
Initial download of the metrics may take a while.