Fig. 4
Download original image
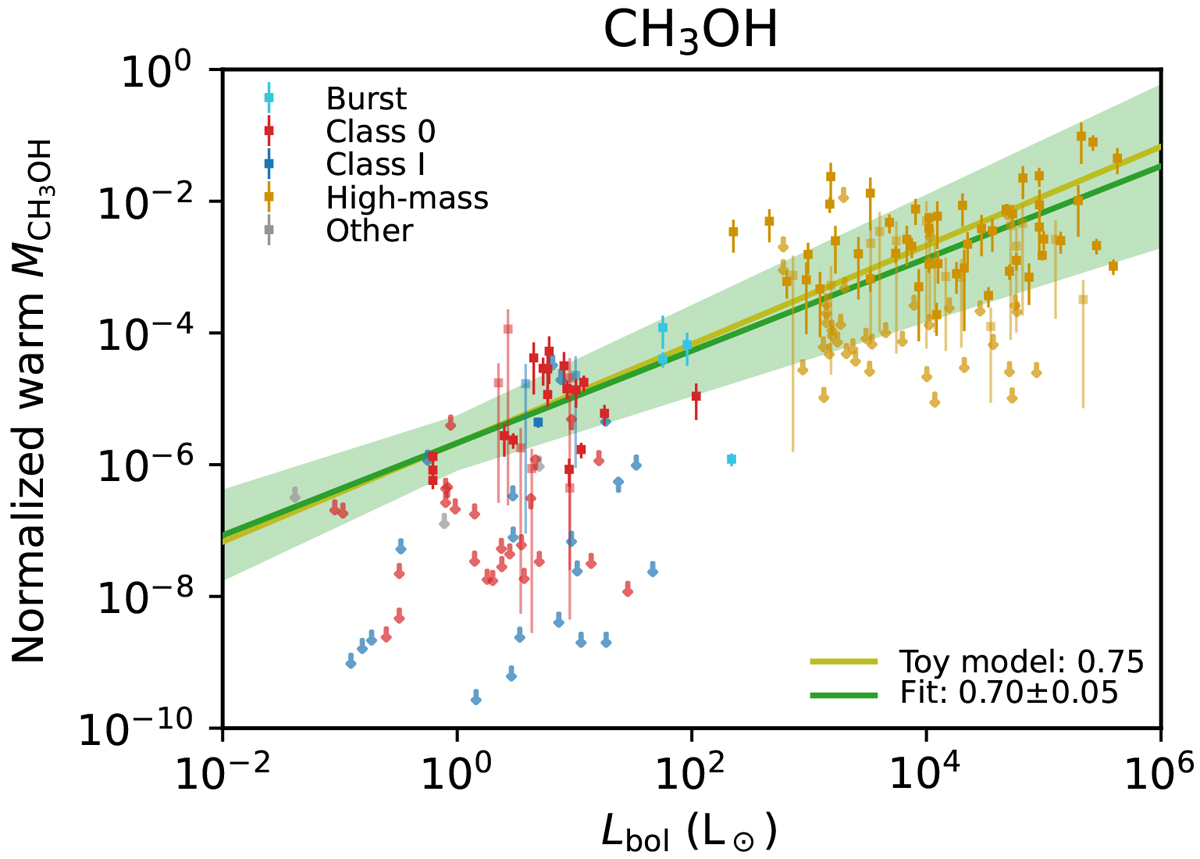
Normalized warm gaseous CH3OH mass, ![]() , as a function of the bolometric luminosity. Different colors denote different observational classes, and all sources with Lb0l > 1000 L⊙ are classified as high-mass sources. Additionally, sources that are suggested to currently be in a burst phase (e.g., V883 Ori and IRAS2A; van ‘t Hoff et al. 2018; Lee et al. 2019b; Hsieh et al. 2019) are highlighted. Sources in the “other” category include Class II and flat spectrum sources. The green line indicates the best-fit power-law model to the data points (excluding the upper limits) and the green shaded area the 3σ uncertainty on the fit. The yellow line indicates the relation for the toy model of Eq. (4) scaled to match the best-fit power-law model.
, as a function of the bolometric luminosity. Different colors denote different observational classes, and all sources with Lb0l > 1000 L⊙ are classified as high-mass sources. Additionally, sources that are suggested to currently be in a burst phase (e.g., V883 Ori and IRAS2A; van ‘t Hoff et al. 2018; Lee et al. 2019b; Hsieh et al. 2019) are highlighted. Sources in the “other” category include Class II and flat spectrum sources. The green line indicates the best-fit power-law model to the data points (excluding the upper limits) and the green shaded area the 3σ uncertainty on the fit. The yellow line indicates the relation for the toy model of Eq. (4) scaled to match the best-fit power-law model.
Current usage metrics show cumulative count of Article Views (full-text article views including HTML views, PDF and ePub downloads, according to the available data) and Abstracts Views on Vision4Press platform.
Data correspond to usage on the plateform after 2015. The current usage metrics is available 48-96 hours after online publication and is updated daily on week days.
Initial download of the metrics may take a while.