Fig. 2
Download original image
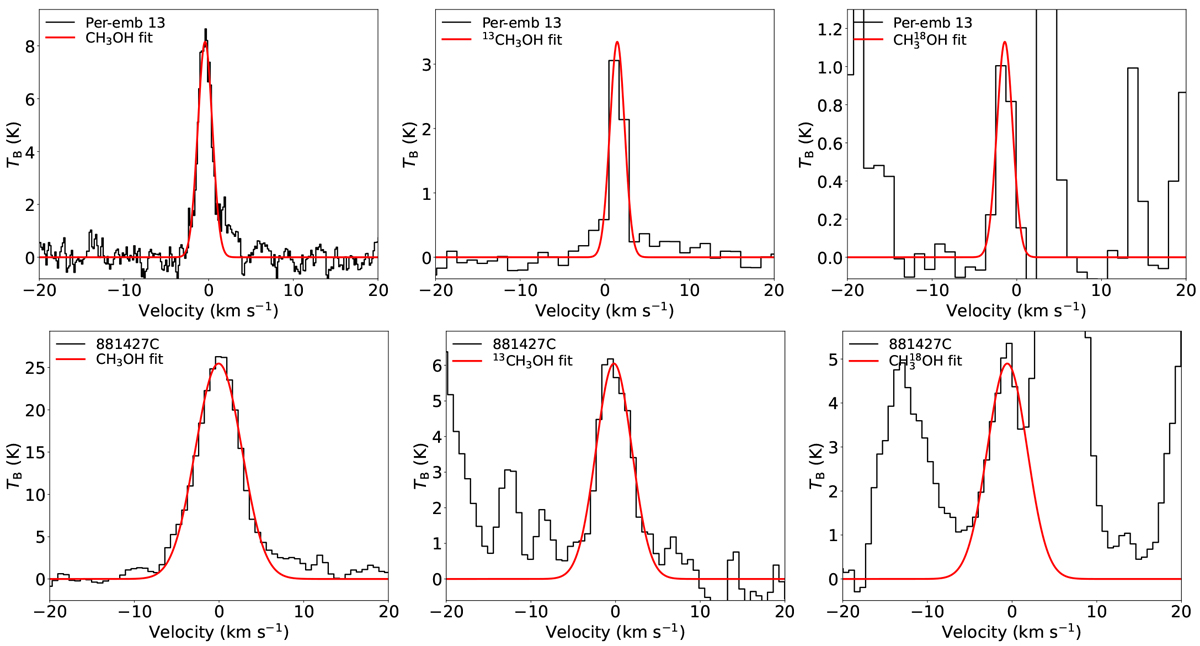
Spectral line fits of CH3OH (left), 13CH3OH (middle), and ![]() (right) for Per-emb 13 from the PEACHES sample (top row) and 881427C from the ALMAGAL sample (bottom row). The data corrected for the Vlsr are shown in black, and the fit for Tex = 150 K is shown in red. All lines are >3σ detections. The top row shows the CH3OH 51,4−41,3 (Eup = 50 K), 13CH3OH 233,20−232,21 (Eup = 675 K), and
(right) for Per-emb 13 from the PEACHES sample (top row) and 881427C from the ALMAGAL sample (bottom row). The data corrected for the Vlsr are shown in black, and the fit for Tex = 150 K is shown in red. All lines are >3σ detections. The top row shows the CH3OH 51,4−41,3 (Eup = 50 K), 13CH3OH 233,20−232,21 (Eup = 675 K), and ![]() lines, and the bottom row shows the CH3OH 80,8−71,6 (Eup = 97 K), 13CH3OH 141,з−132,12 (Eup = 254 K), and
lines, and the bottom row shows the CH3OH 80,8−71,6 (Eup = 97 K), 13CH3OH 141,з−132,12 (Eup = 254 K), and ![]() lines.
lines.
Current usage metrics show cumulative count of Article Views (full-text article views including HTML views, PDF and ePub downloads, according to the available data) and Abstracts Views on Vision4Press platform.
Data correspond to usage on the plateform after 2015. The current usage metrics is available 48-96 hours after online publication and is updated daily on week days.
Initial download of the metrics may take a while.