Fig. 1
Download original image
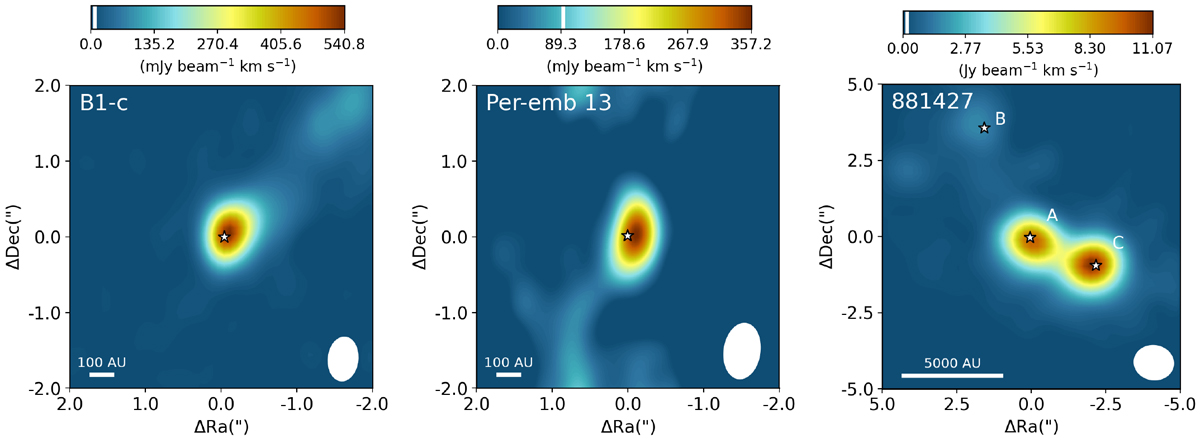
Integrated intensity maps of the CH3 OH 21,1−10,1 line for the low-mass protostar B1-c (left), the CH3OH 51,4−41,3 line for the low-mass protostar Per-emb 13 from PEACHES (middle), and the CH3OH 80,8−71,6 line for the high-mass 881427 cluster (right). The color scale is shown on top of each image. The images are integrated over [−5,5] km s−1 with respect to the Vlsr. The white vertical line in the colorbar indicates the 3σ threshold. The peaks in the continuum are indicated with the white stars. The white ellipse in the lower right of each image depicts the beam size, and in the lower left a physical scale bar is displayed.
Current usage metrics show cumulative count of Article Views (full-text article views including HTML views, PDF and ePub downloads, according to the available data) and Abstracts Views on Vision4Press platform.
Data correspond to usage on the plateform after 2015. The current usage metrics is available 48-96 hours after online publication and is updated daily on week days.
Initial download of the metrics may take a while.