Free Access
Fig. 13.
Download original image
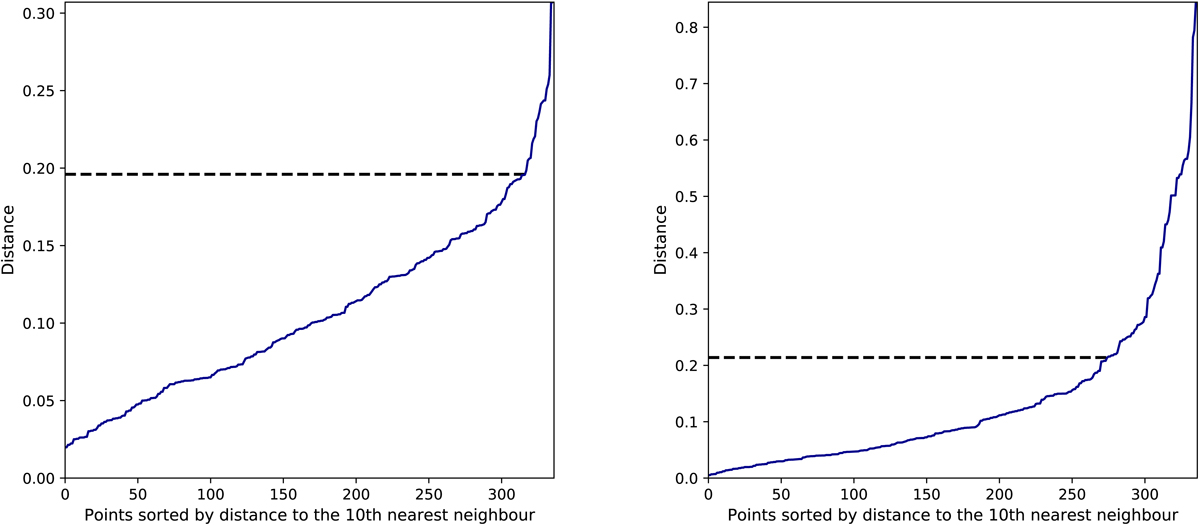
Points sorted by distance to the tenth nearest neighbour in position space (left) and velocity space (right). The distance is based on the standardised data. The dashed line shows the knee value of the plot from which the best length scale is determined.
Current usage metrics show cumulative count of Article Views (full-text article views including HTML views, PDF and ePub downloads, according to the available data) and Abstracts Views on Vision4Press platform.
Data correspond to usage on the plateform after 2015. The current usage metrics is available 48-96 hours after online publication and is updated daily on week days.
Initial download of the metrics may take a while.