Open Access
Fig. 5
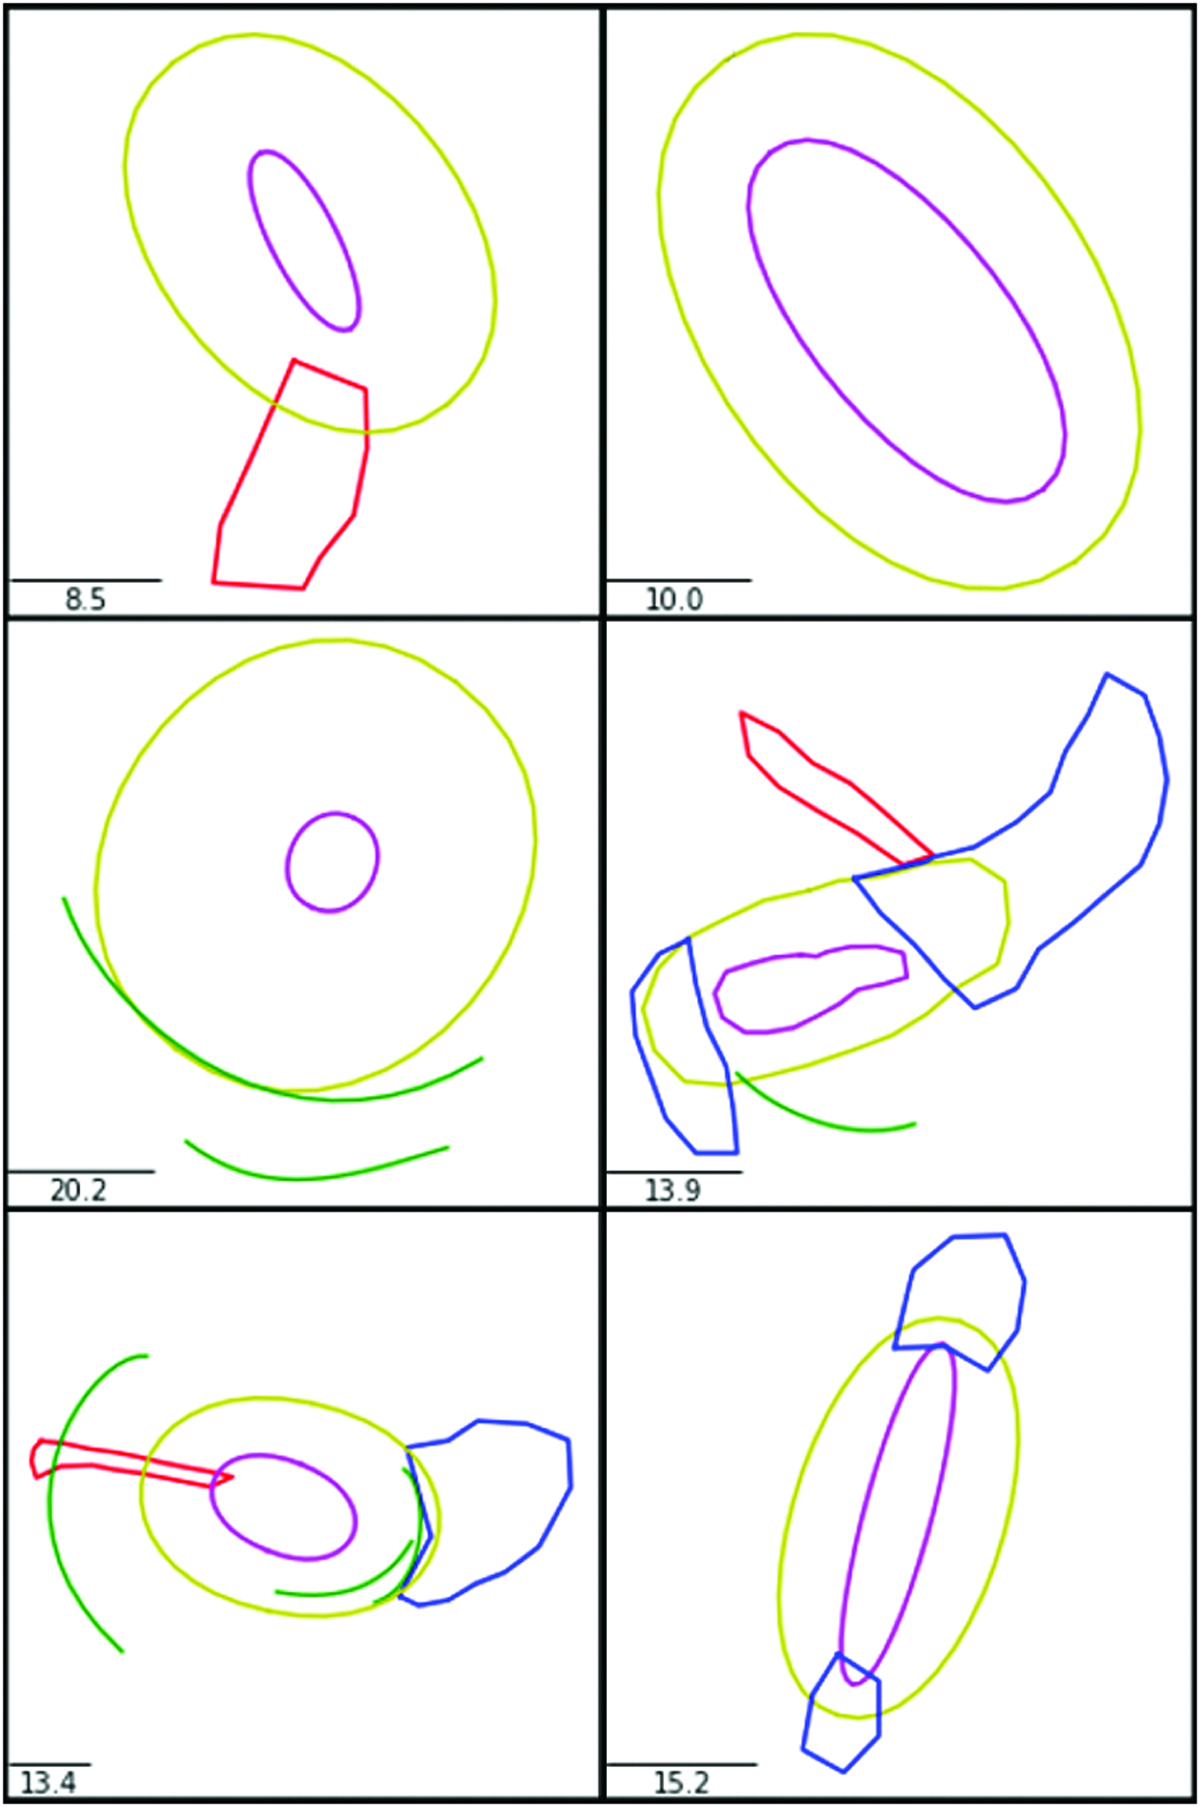
Download original image
Examples of annotation thumbnails. The center of the target galaxy is plotted in purple, its halo in yellow, tidal tails in blue, streams in red and shells in green. A scalebar in kiloparsecs is shown at the bottom left of each thumbnail.
Current usage metrics show cumulative count of Article Views (full-text article views including HTML views, PDF and ePub downloads, according to the available data) and Abstracts Views on Vision4Press platform.
Data correspond to usage on the plateform after 2015. The current usage metrics is available 48-96 hours after online publication and is updated daily on week days.
Initial download of the metrics may take a while.