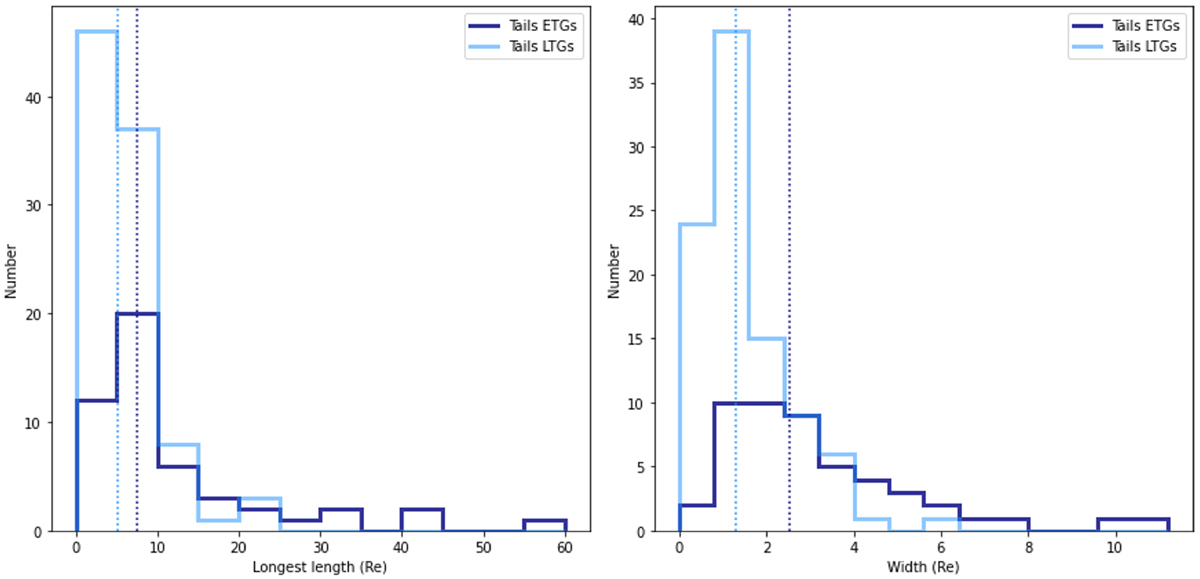
Fig. B.1
Download original image
Histogram of the length (left) and of the width (right) of tidal tails normalized by the effective radius of the host galaxy, as a function of the morphological type. ETGs are represented by darker shades than LTGs. The median of each distribution is represented by the dotted lines. The histogram of the length has bins width of 5 Re and of 0.8 Re for the width.
Current usage metrics show cumulative count of Article Views (full-text article views including HTML views, PDF and ePub downloads, according to the available data) and Abstracts Views on Vision4Press platform.
Data correspond to usage on the plateform after 2015. The current usage metrics is available 48-96 hours after online publication and is updated daily on week days.
Initial download of the metrics may take a while.