Open Access
Fig. 19
Download original image
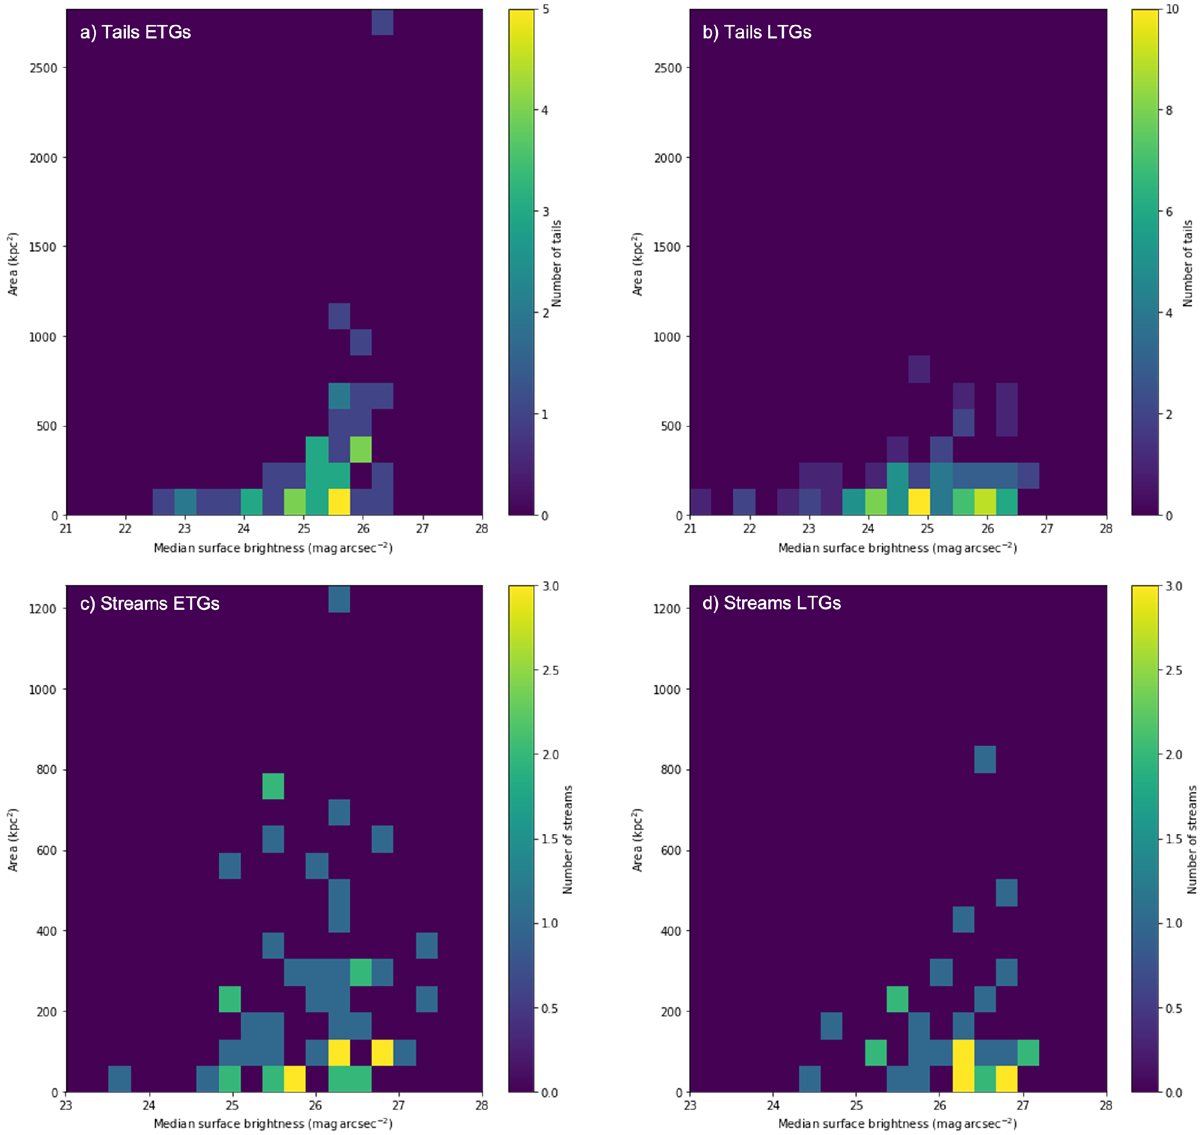
2D histograms of the area (in square kiloparsecs) of tidal tails and streams as a function of the median surface brightness (in mag arcsec−2). This 2D histogram for tidal tails around ETGs is presented in panel a and for LTGs in panel b. For streams, the histogram for ETGs is visible in panel c and in panel d for LTGs.
Current usage metrics show cumulative count of Article Views (full-text article views including HTML views, PDF and ePub downloads, according to the available data) and Abstracts Views on Vision4Press platform.
Data correspond to usage on the plateform after 2015. The current usage metrics is available 48-96 hours after online publication and is updated daily on week days.
Initial download of the metrics may take a while.