Fig. 1
Download original image
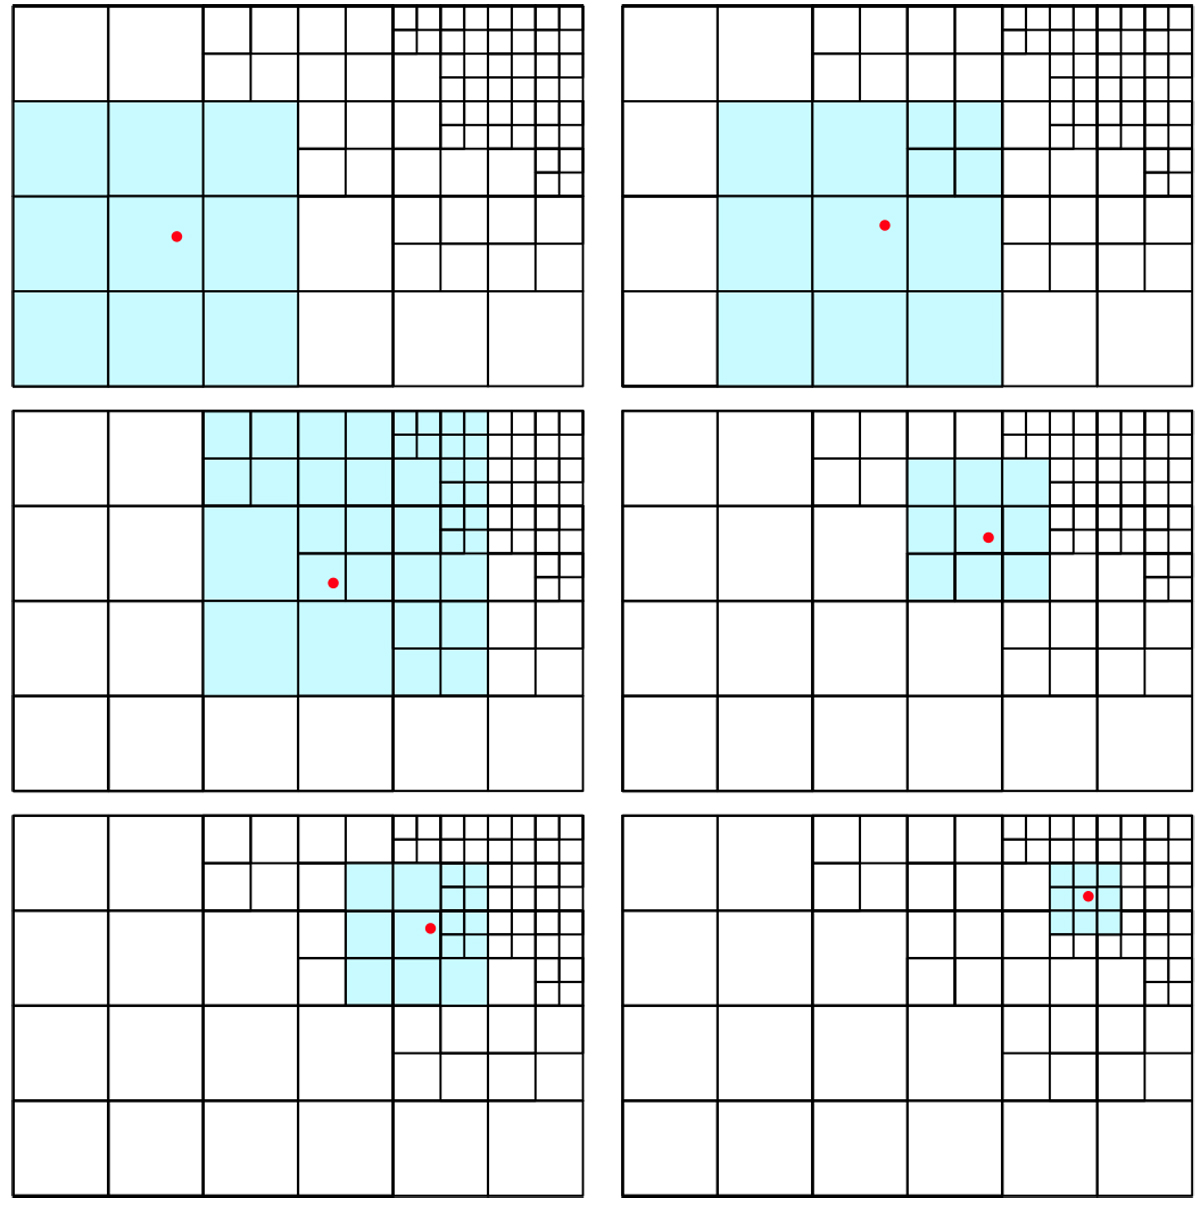
Illustration of the TSC interpolation scheme at a given location in an AMR grid in 2D. Red points refer to some locations on the grid (which can be for example the position of a photon during its propagation) and the cells used to perform the interpolation are highlighted in blue. The interpolation is done at fixed level, meaning that when the interpolation level is set, we do not use the information from coarser or finer cells.
Current usage metrics show cumulative count of Article Views (full-text article views including HTML views, PDF and ePub downloads, according to the available data) and Abstracts Views on Vision4Press platform.
Data correspond to usage on the plateform after 2015. The current usage metrics is available 48-96 hours after online publication and is updated daily on week days.
Initial download of the metrics may take a while.