Fig. 6
Download original image
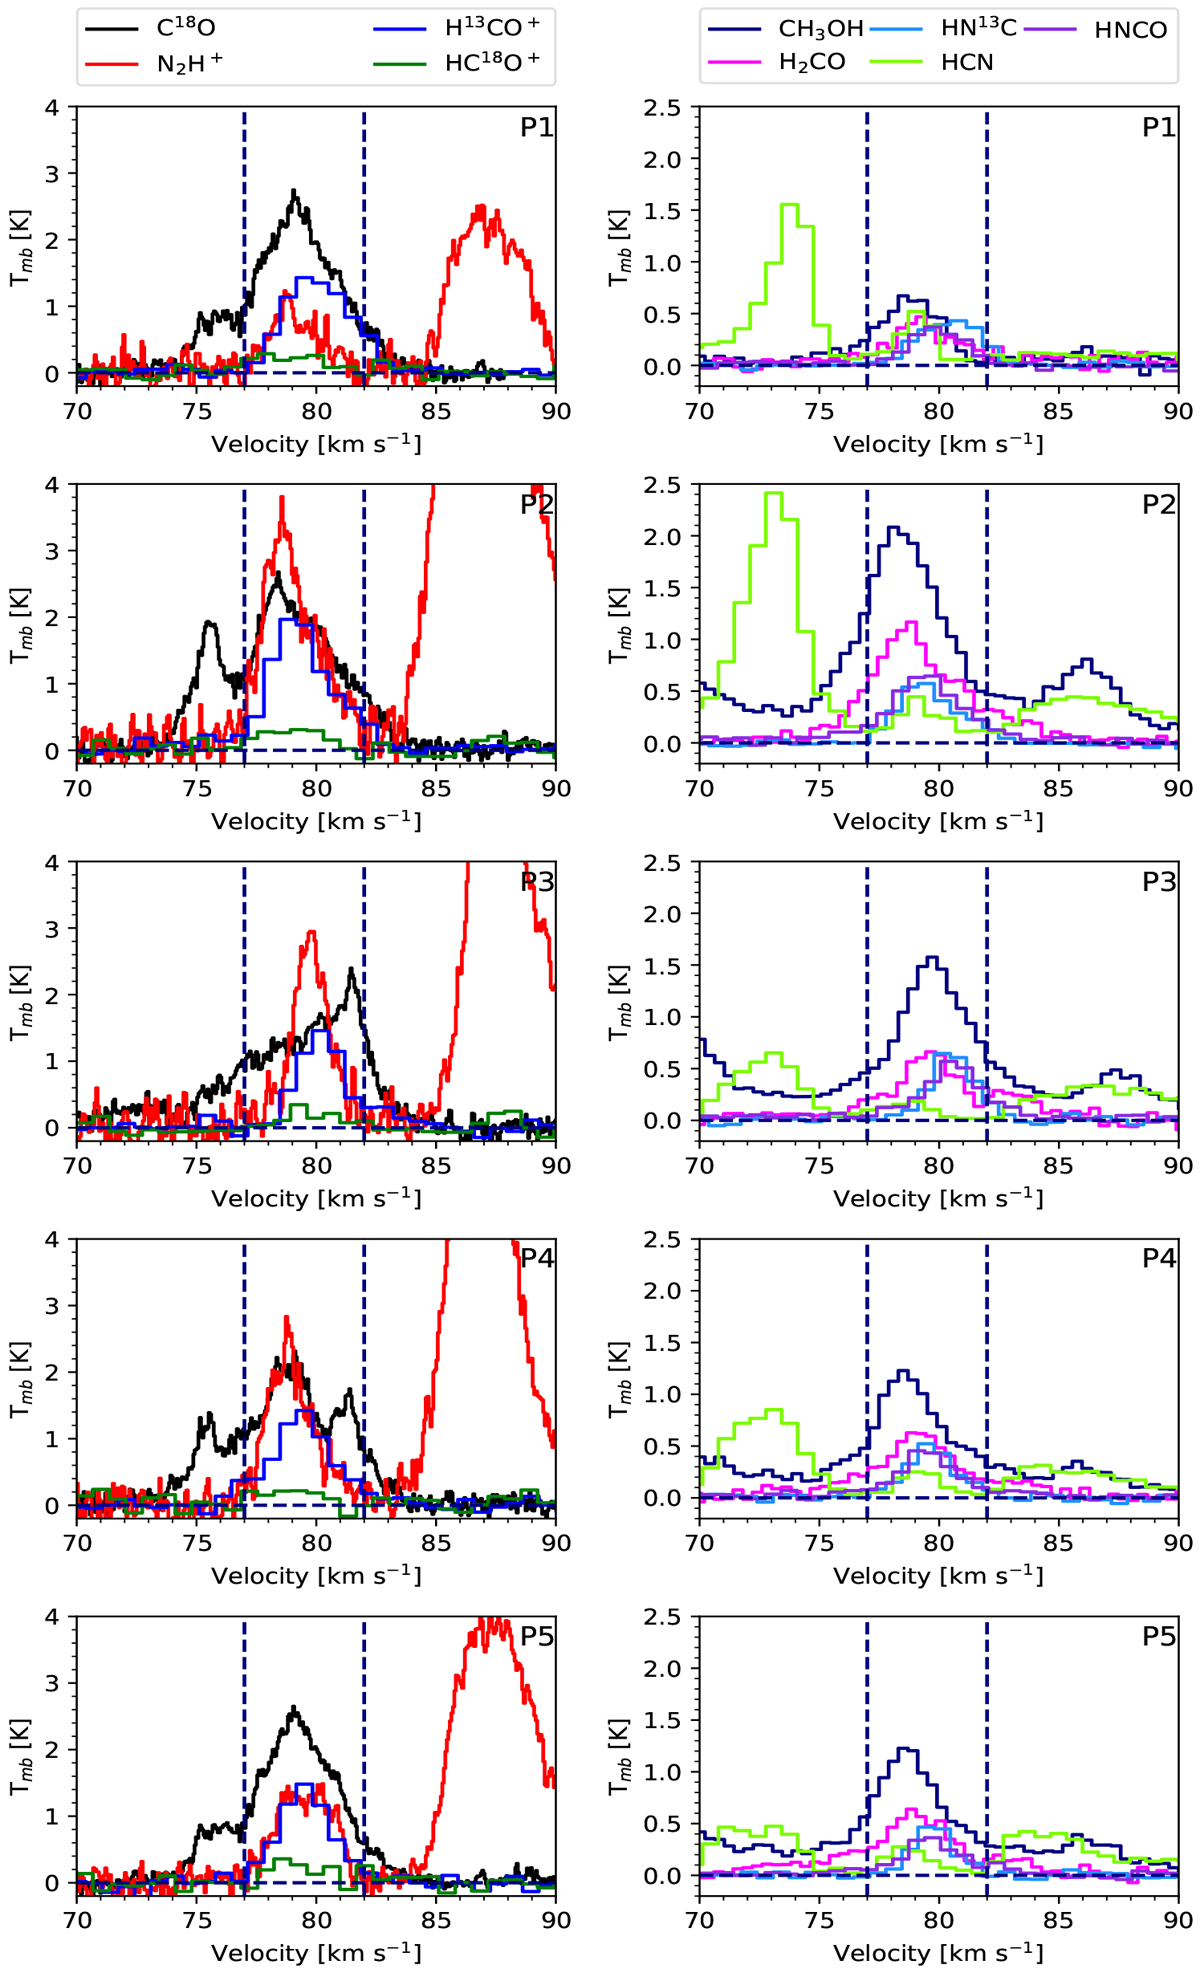
Fig. 6. – Spectra of observed species at positions P1-P5. The dashed lines indicate the velocity range 77-82 km s−1, which has been selected to cover the dense gas as traced by N2H+ and H13CO+. In the left column panels, the amplitudes of the signals of H13CO+(1-0), HC18O+ (1-0) and N2H+(1-0) have been multiplied by a factor of three for clarity of display.
Current usage metrics show cumulative count of Article Views (full-text article views including HTML views, PDF and ePub downloads, according to the available data) and Abstracts Views on Vision4Press platform.
Data correspond to usage on the plateform after 2015. The current usage metrics is available 48-96 hours after online publication and is updated daily on week days.
Initial download of the metrics may take a while.