Fig. 4
Download original image
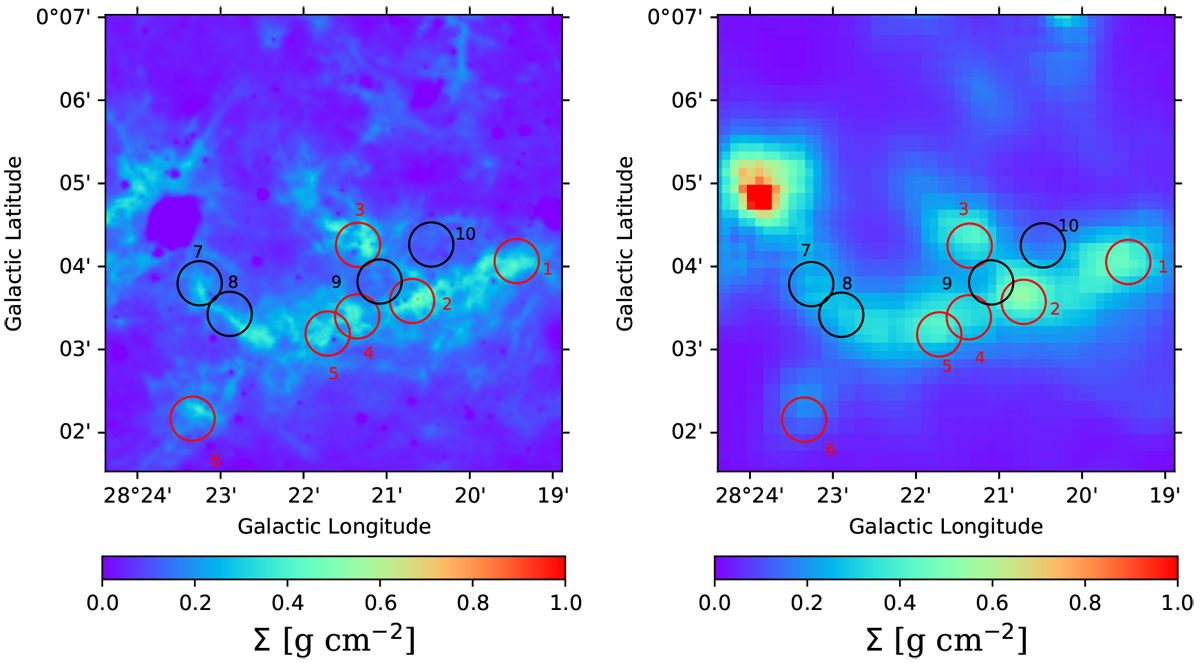
(a): MIREX derived mass surface density map of IRDC G28.37+00.07 from Kainulainen & Tan (2013) (scalebar is in g cm−2). The 10 regions selected for our astrochemical study are marked with circles, labelled 1 to 10. Regions 1 to 6 (red) are known to harbour some star formation activity, while regions 7-10 have been specifically selected to avoid known protostellar sources. (b): sub-mm emission derived mass surface density map of the IRDC from Lim et al. (2016) using the Galactic Gaussian method of foreground-background subtraction (scalebar is in g cm−2). We note that it is of significantly lower angular resolution than the MIREX map (see text). The analysed positions are marked as in (a).
Current usage metrics show cumulative count of Article Views (full-text article views including HTML views, PDF and ePub downloads, according to the available data) and Abstracts Views on Vision4Press platform.
Data correspond to usage on the plateform after 2015. The current usage metrics is available 48-96 hours after online publication and is updated daily on week days.
Initial download of the metrics may take a while.