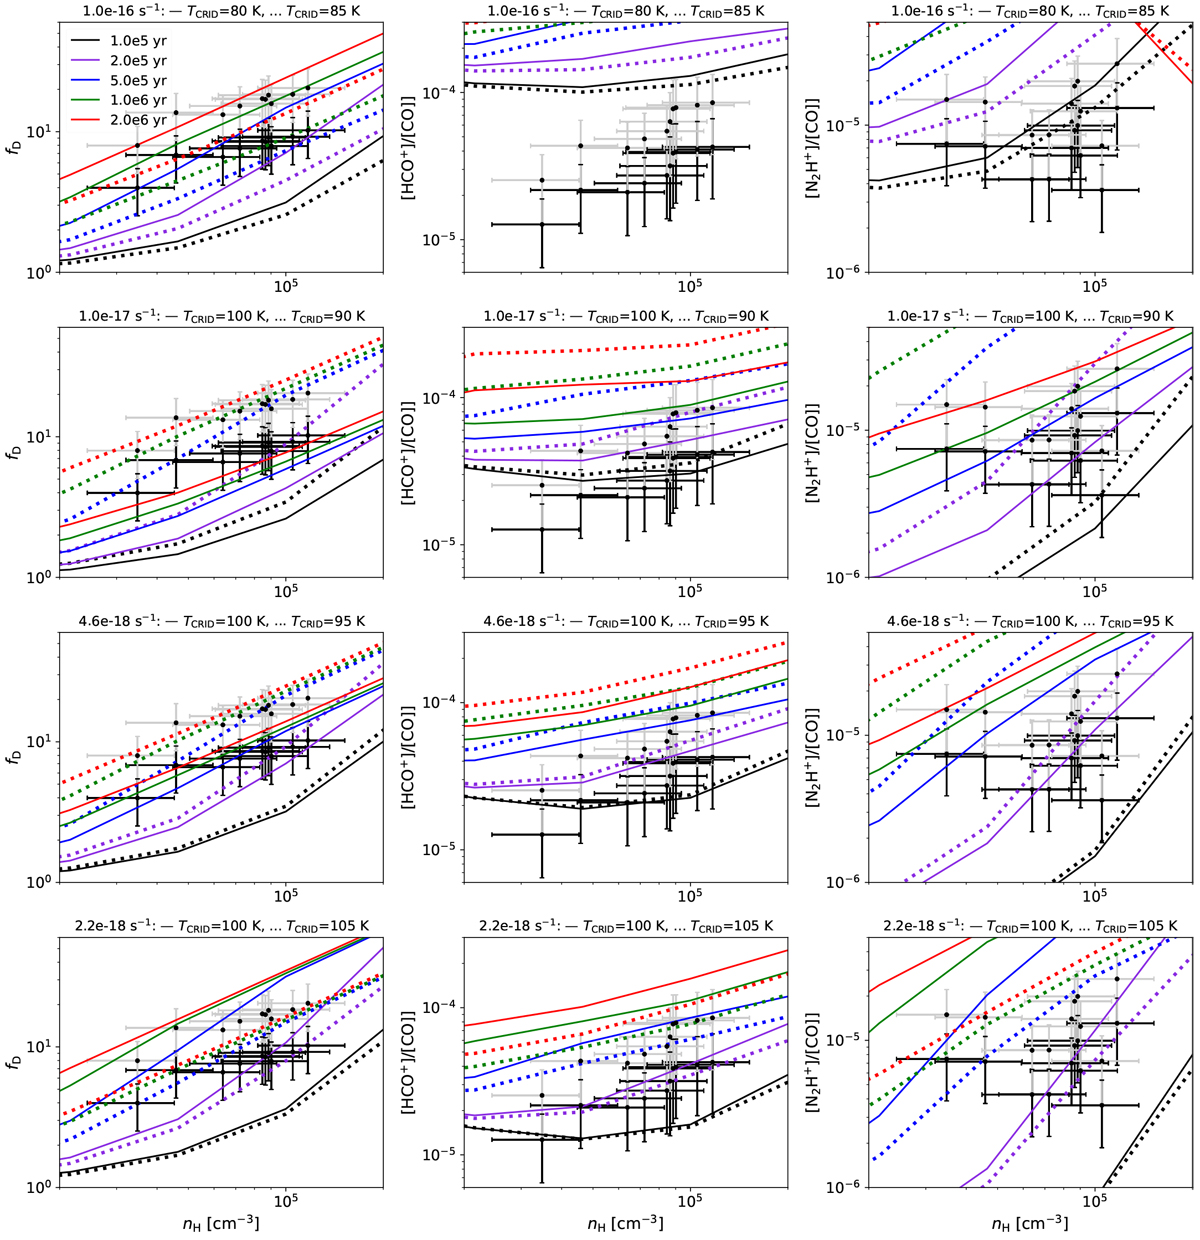
Fig. 33
Download original image
Exploration of Case 1 fitting of the whole IRDC clump sample, including trends with density, using models with gas temperature of T = 15 K, Av = 20 mag, CO ice binding energy of 1100 K and exploring effects of cosmic ray induced desorption parameter Tcrid. Left column panels show fD versus nH; middle column panels show [HCO+]/[CO] versus nH; right column panels show [N2H+]/[CO] versus nH. In all panels, black points are the actual observed data (with HCO+ obtained from HC18O+), while the grey points assume CO abundance is reduced by a factor of 2 (due to CO envelope contamination). (a) First row: high CRIR case with ζ = 1.0 × 10⁻¹⁶ s−1. Solid lines are models with Tcrid = 80 K and dotted lines are those with Tcrid = 85 K. As shown in the legend, the various colours correspond to models from 0.1 to 2 Myr. (b) Second row: case with ζ = 1.0 × 10⁻¹⁷ s−1. Solid lines are models with Tcrid = 100 K and dotted lines are those with Tcrid = 90 K. (c) Third row: case with ζ = 4.6 × 10⁻¹⁸ s−1. Solid lines are models with Tcrid = 100 K and dotted lines are those with Tcrid = 95 K. (d) Fourth row: case with ζ = 2.2 × 10⁻¹⁸ s−1. Solid lines are models with Tcrid = 100 K and dotted lines are those with Tcrid = 105 K.
Current usage metrics show cumulative count of Article Views (full-text article views including HTML views, PDF and ePub downloads, according to the available data) and Abstracts Views on Vision4Press platform.
Data correspond to usage on the plateform after 2015. The current usage metrics is available 48-96 hours after online publication and is updated daily on week days.
Initial download of the metrics may take a while.