Fig. 32
Download original image
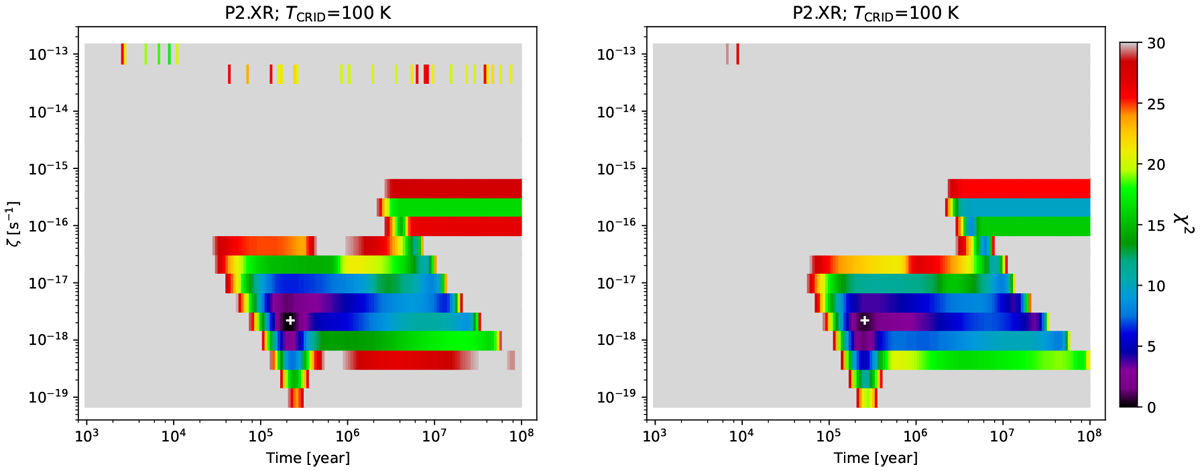
(a) Left: example of XR Case 1 fitting of P2 abundances (HCO+ from HC18O+) using astrochemical model Grid 2 (i.e. CO ice binding energy of 1100 K and Tcrid = 100 K) showing the projected best χ2 values in the ζ versus t plane. The location of minimum χ2 is marked with a white cross. (b) Right: as (a), but now for [CO] reduced by a factor of two (allowing for potential CO envelope contamination).
Current usage metrics show cumulative count of Article Views (full-text article views including HTML views, PDF and ePub downloads, according to the available data) and Abstracts Views on Vision4Press platform.
Data correspond to usage on the plateform after 2015. The current usage metrics is available 48-96 hours after online publication and is updated daily on week days.
Initial download of the metrics may take a while.