Fig. 27
Download original image
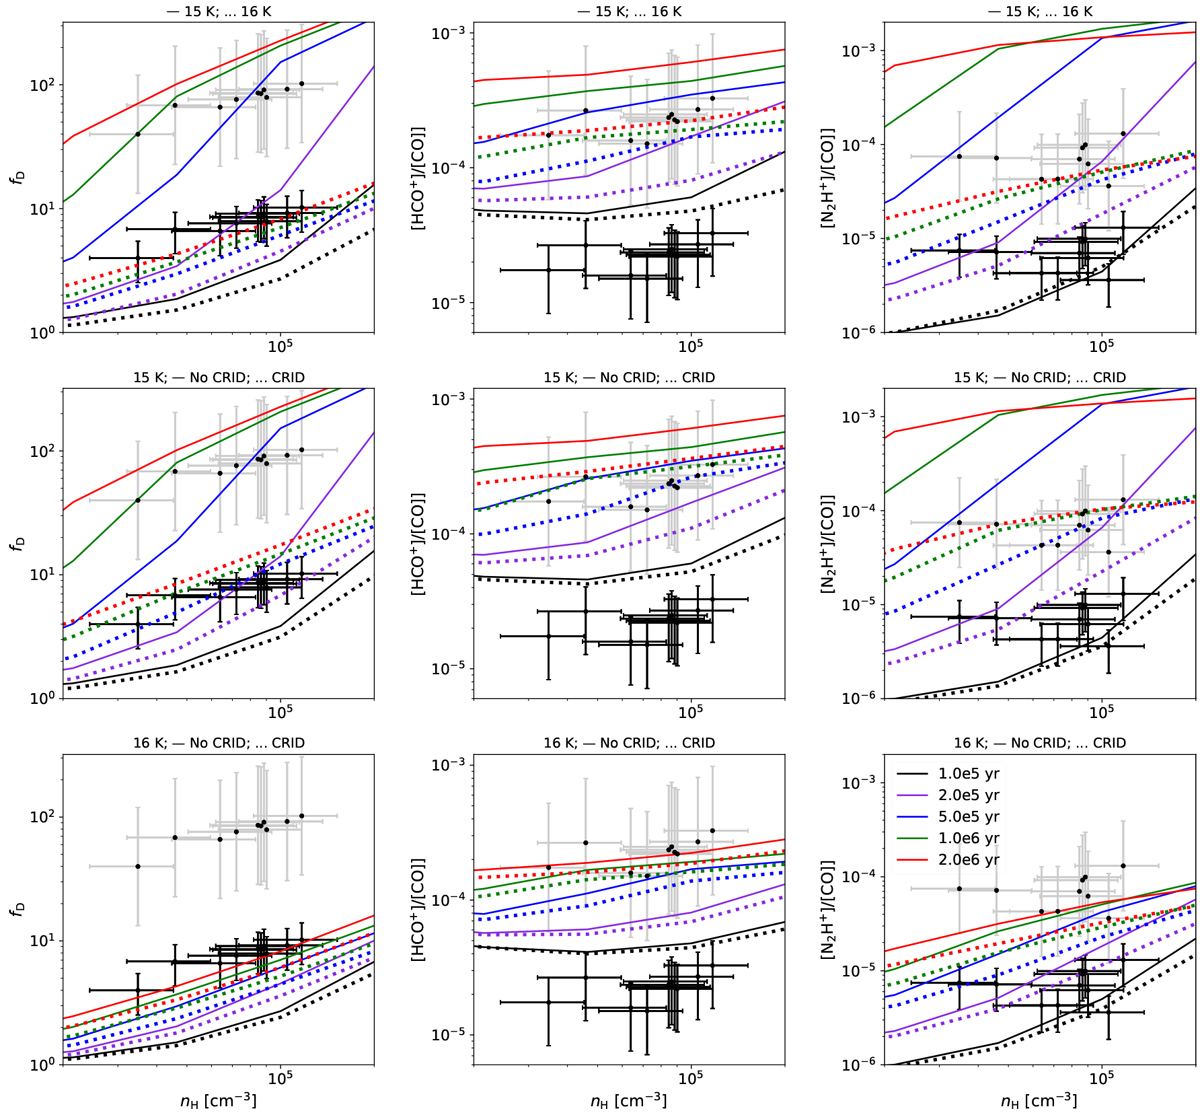
Exploration of Case 1 fitting of the whole IRDC clump sample, including trends with density. Left column panels show fD versus nH; middle column panels show [HCO+]/[CO] versus nH; right column panels show [N2H+]/[CO] versus nH. In all panels, the black points are the observed data, while grey points assume CO envelope contamination of 90% (see text). (a) First row: temperature comparison; models have ζ = 2.2 × 10⁻¹⁷ s−1, Av = 20 mag. Solid lines are from the models with T = 15 K and dotted lines from those of T = 16 K. (b) Second row: CRID comparison at 15 K; models have ζ = 2.2 × 10⁻¹⁷ s−1, Av = 20 mag and T = 15 K. Solid lines are from the models without CRID; dotted lines are with CRID. (c) Third row: CRID comparison at 16 K; results as (b), but with T = 16 K.
Current usage metrics show cumulative count of Article Views (full-text article views including HTML views, PDF and ePub downloads, according to the available data) and Abstracts Views on Vision4Press platform.
Data correspond to usage on the plateform after 2015. The current usage metrics is available 48-96 hours after online publication and is updated daily on week days.
Initial download of the metrics may take a while.