Fig. 26
Download original image
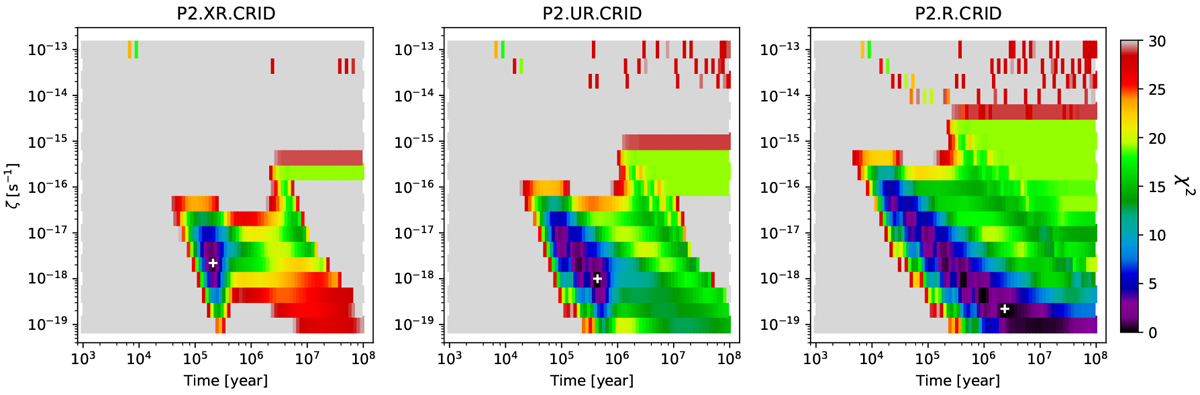
Effects of CRID. The panels show the projected best χ2 values in the ζ versus t plane for the P2 position for the XR (left), UR (middle) and R (right) search methods using models with CRID included for Case 1 (fitting to abundances of CO, HCO+ and N2H+). The location of the minimum χ2 is marked with a white cross in each panel. Temperature is set to be 15 K for all panels.
Current usage metrics show cumulative count of Article Views (full-text article views including HTML views, PDF and ePub downloads, according to the available data) and Abstracts Views on Vision4Press platform.
Data correspond to usage on the plateform after 2015. The current usage metrics is available 48-96 hours after online publication and is updated daily on week days.
Initial download of the metrics may take a while.