Fig. 25
Download original image
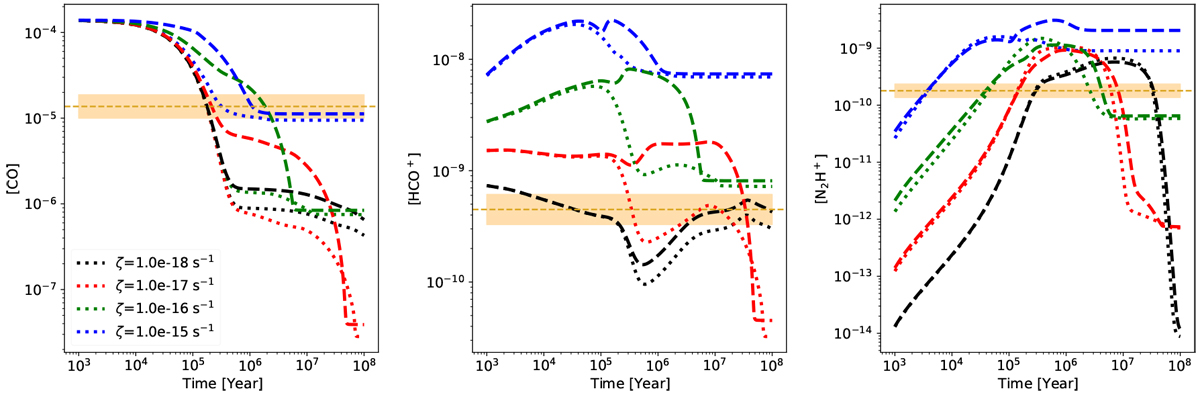
Effects of CR induced desorption (CRID). Time evolution of the abundances of the Case 1 species CO (left), HCO+ (middle) and N2H+ (right) in the models with nH = 1.0 × 105 cm−3, T = 15 K and Av = 20 mag for several different CRIRs. The dotted lines show the fiducial case in which CRID is not included. The dashed lines show the case in which CRID is included with a standard rate (see text). The horizontal bands show the observed abundances together with their uncertainties at P2.
Current usage metrics show cumulative count of Article Views (full-text article views including HTML views, PDF and ePub downloads, according to the available data) and Abstracts Views on Vision4Press platform.
Data correspond to usage on the plateform after 2015. The current usage metrics is available 48-96 hours after online publication and is updated daily on week days.
Initial download of the metrics may take a while.