Fig. 21
Download original image
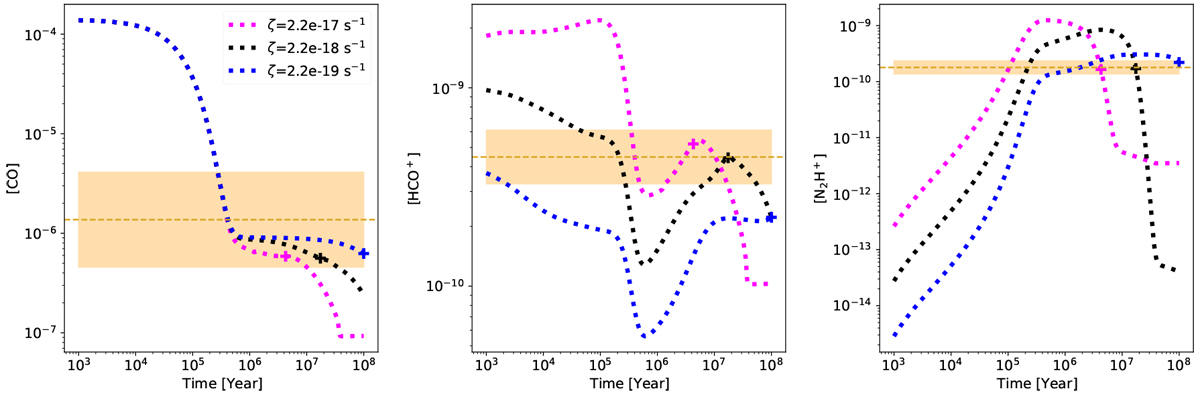
Investigation of effect of CO envelope contamination showing time evolution of [CO] (left), [HCO+] (middle) and [N2H+] (right) for the overall best fitting model (black line, ζ = 2.2 × 10⁻¹⁸ s−1). Here the observed CO abundance has been reduced by a factor of 10 and the total uncertainty set to be a factor of 3. The effects of varying the CRIR by a factor of 10 to higher (magenta) and lower (blue) values compared to the XR best model value are shown. The best timescales for each of the models are marked with corresponding ‘+’ symbols.
Current usage metrics show cumulative count of Article Views (full-text article views including HTML views, PDF and ePub downloads, according to the available data) and Abstracts Views on Vision4Press platform.
Data correspond to usage on the plateform after 2015. The current usage metrics is available 48-96 hours after online publication and is updated daily on week days.
Initial download of the metrics may take a while.