Free Access
Fig. 17
Download original image
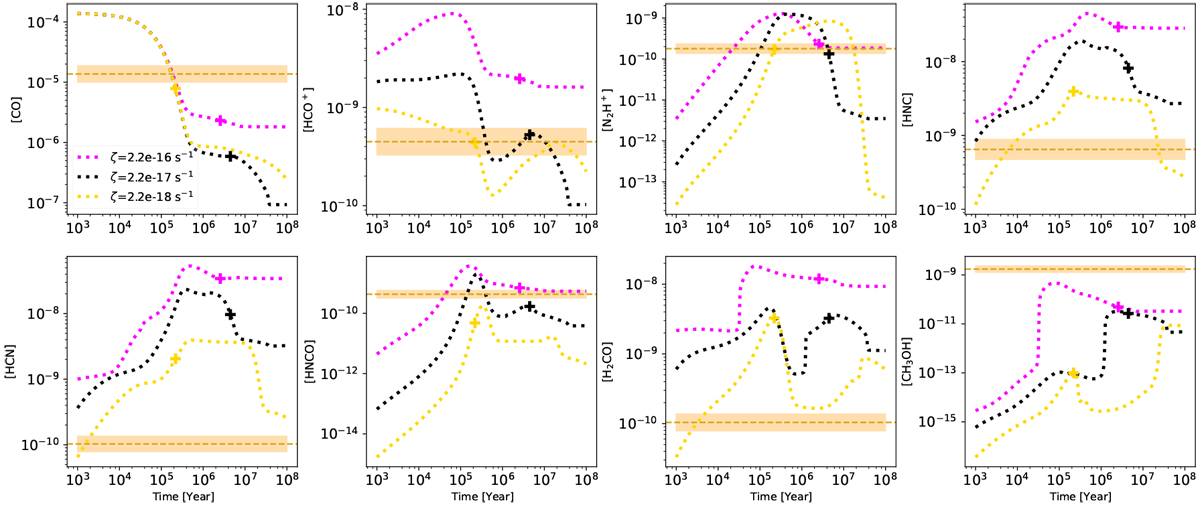
As Fig. 16, but now showing the effect of varying the CRIR by a factor of 10 to higher (magenta) and lower (yellow) values compared to the XR best model value of ζ = 2.2 × 10⁻¹⁷ s−1. The overall best timescales for each of the models are shown with corresponding ‘+’ symbols, given the observed abundances of the P2 location.
Current usage metrics show cumulative count of Article Views (full-text article views including HTML views, PDF and ePub downloads, according to the available data) and Abstracts Views on Vision4Press platform.
Data correspond to usage on the plateform after 2015. The current usage metrics is available 48-96 hours after online publication and is updated daily on week days.
Initial download of the metrics may take a while.