Fig. 16
Download original image
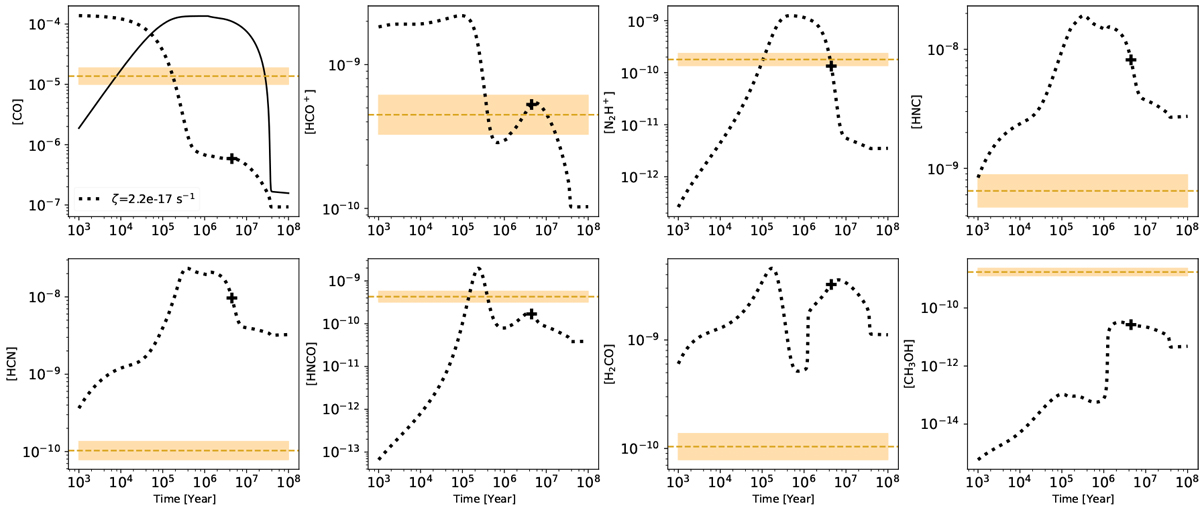
Time evolution of [CO] (gas [dotted] and ice [solid] phases) (top left). The remaining panels show the equivalent panels for the gas phase abundances of the rest of the species for the overall best fitting model (ζ = 2.2 × 10⁻¹⁷ s−1), for the XR search of the P2 clump, that is with nH = 1.0 × 105 cm−3, Av = 20 mag and T = 15 K. The time of the best overall model along each of these tracks is marked with a ‘+’ symbol. Horizontal dotted lines show the observed values of abundances, with the uncertainties shown by the shaded bands.
Current usage metrics show cumulative count of Article Views (full-text article views including HTML views, PDF and ePub downloads, according to the available data) and Abstracts Views on Vision4Press platform.
Data correspond to usage on the plateform after 2015. The current usage metrics is available 48-96 hours after online publication and is updated daily on week days.
Initial download of the metrics may take a while.