Fig. 15
Download original image
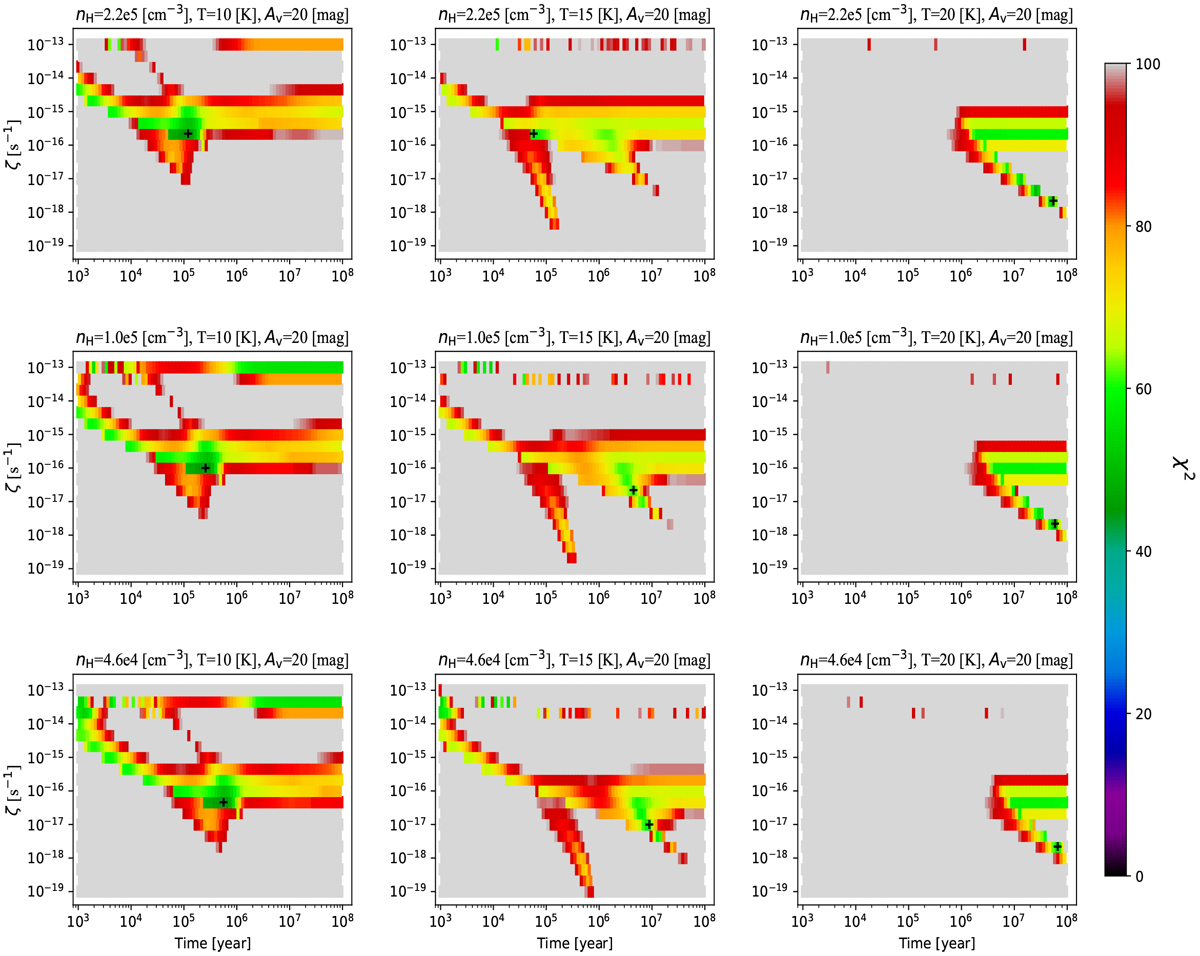
The central panel shows the χ2 landscape (up to values of 100) in the ζ versus t plane for the P2 position for the XR search (i.e. with nH = 1.0 × 105 cm−3, Av = 20 mag and T = 15 K) Case 2 (fitting to abundances of all species). The location of the minimum χ2 is marked with a black cross. The surrounding eight panels show the effect on the χ2 landscape of stepping in the model grid to the next higher and lower values of density and temperature (as labelled). We note that Av is held fixed at 20 mag in all these panels (so these are just a subset of the UR search).
Current usage metrics show cumulative count of Article Views (full-text article views including HTML views, PDF and ePub downloads, according to the available data) and Abstracts Views on Vision4Press platform.
Data correspond to usage on the plateform after 2015. The current usage metrics is available 48-96 hours after online publication and is updated daily on week days.
Initial download of the metrics may take a while.