Free Access
Fig. 8.
Download original image
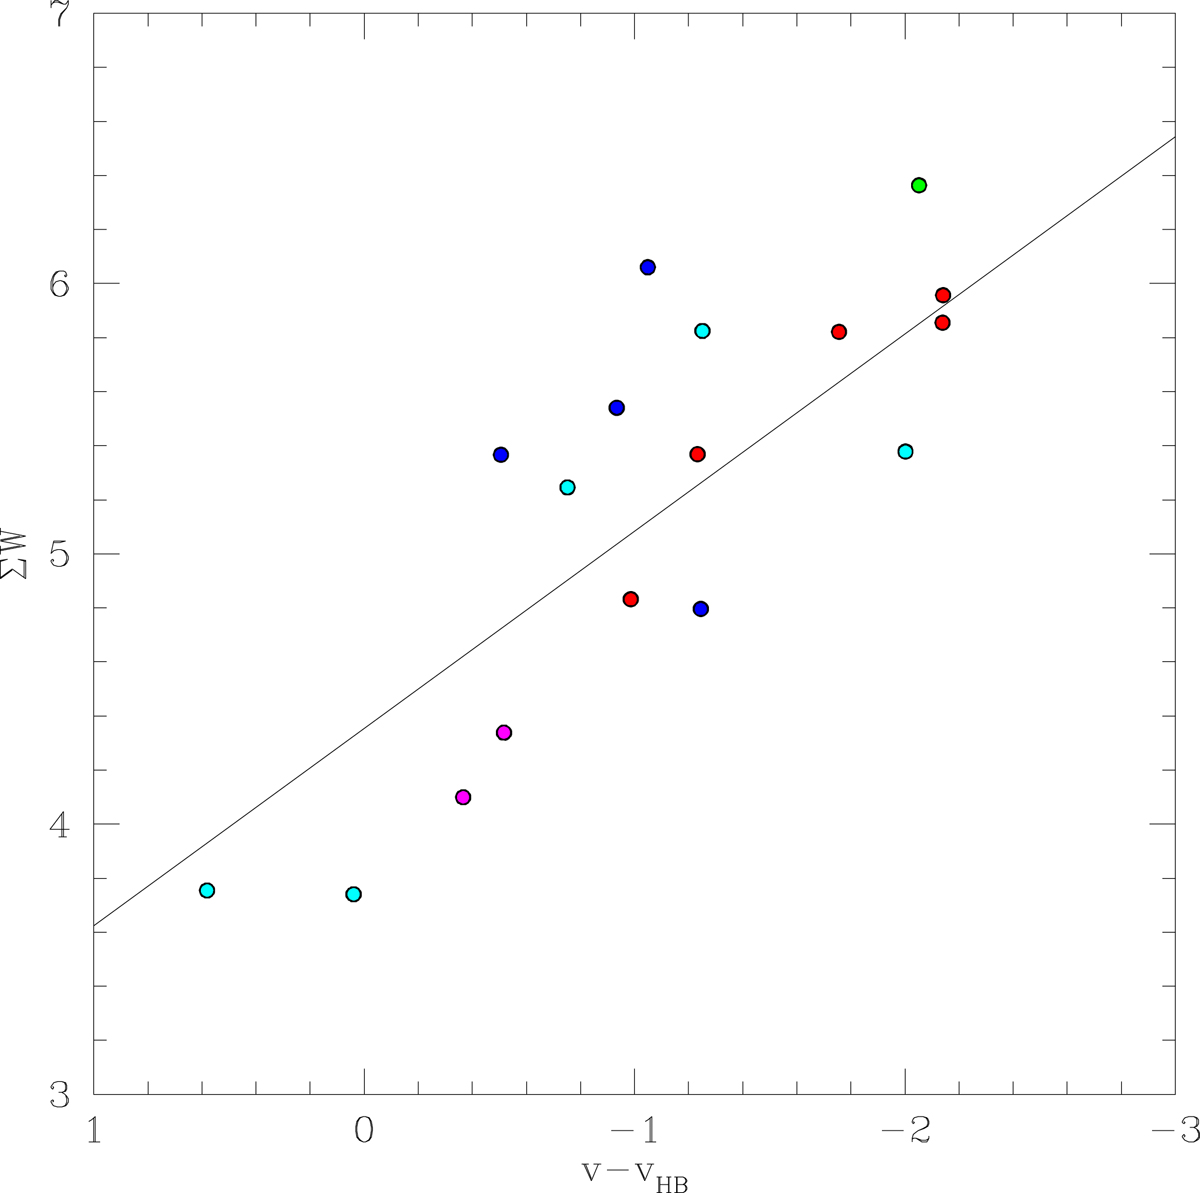
Sum of the equivalent widths of the three CaT lines vs. v − vHB for identified members and non-members of cluster L38. The solid line represents the isometallicity line corresponding to the mean cluster metallicity. The color code is the same as in Fig. 2.
Current usage metrics show cumulative count of Article Views (full-text article views including HTML views, PDF and ePub downloads, according to the available data) and Abstracts Views on Vision4Press platform.
Data correspond to usage on the plateform after 2015. The current usage metrics is available 48-96 hours after online publication and is updated daily on week days.
Initial download of the metrics may take a while.