Free Access
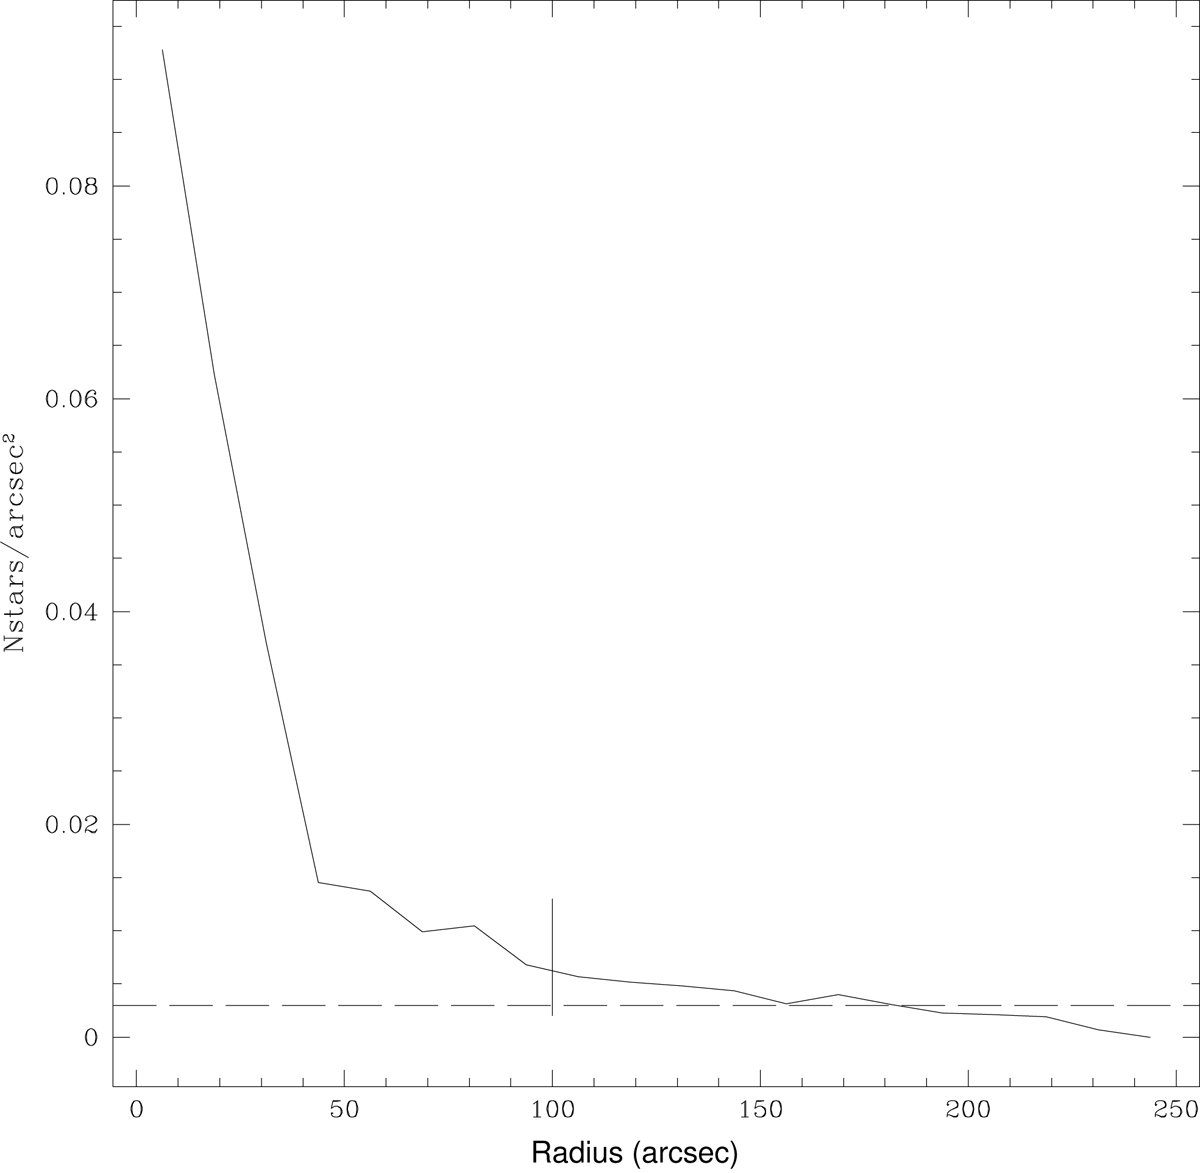
Fig. 4.
Download original image
Radial stellar density profile of cluster L38. The x-axis represents the distance to the cluster center and the y-axis the projected stellar number density. The vertical line marks the adopted cluster radius and the horizontal dashed line is the background density.
Current usage metrics show cumulative count of Article Views (full-text article views including HTML views, PDF and ePub downloads, according to the available data) and Abstracts Views on Vision4Press platform.
Data correspond to usage on the plateform after 2015. The current usage metrics is available 48-96 hours after online publication and is updated daily on week days.
Initial download of the metrics may take a while.