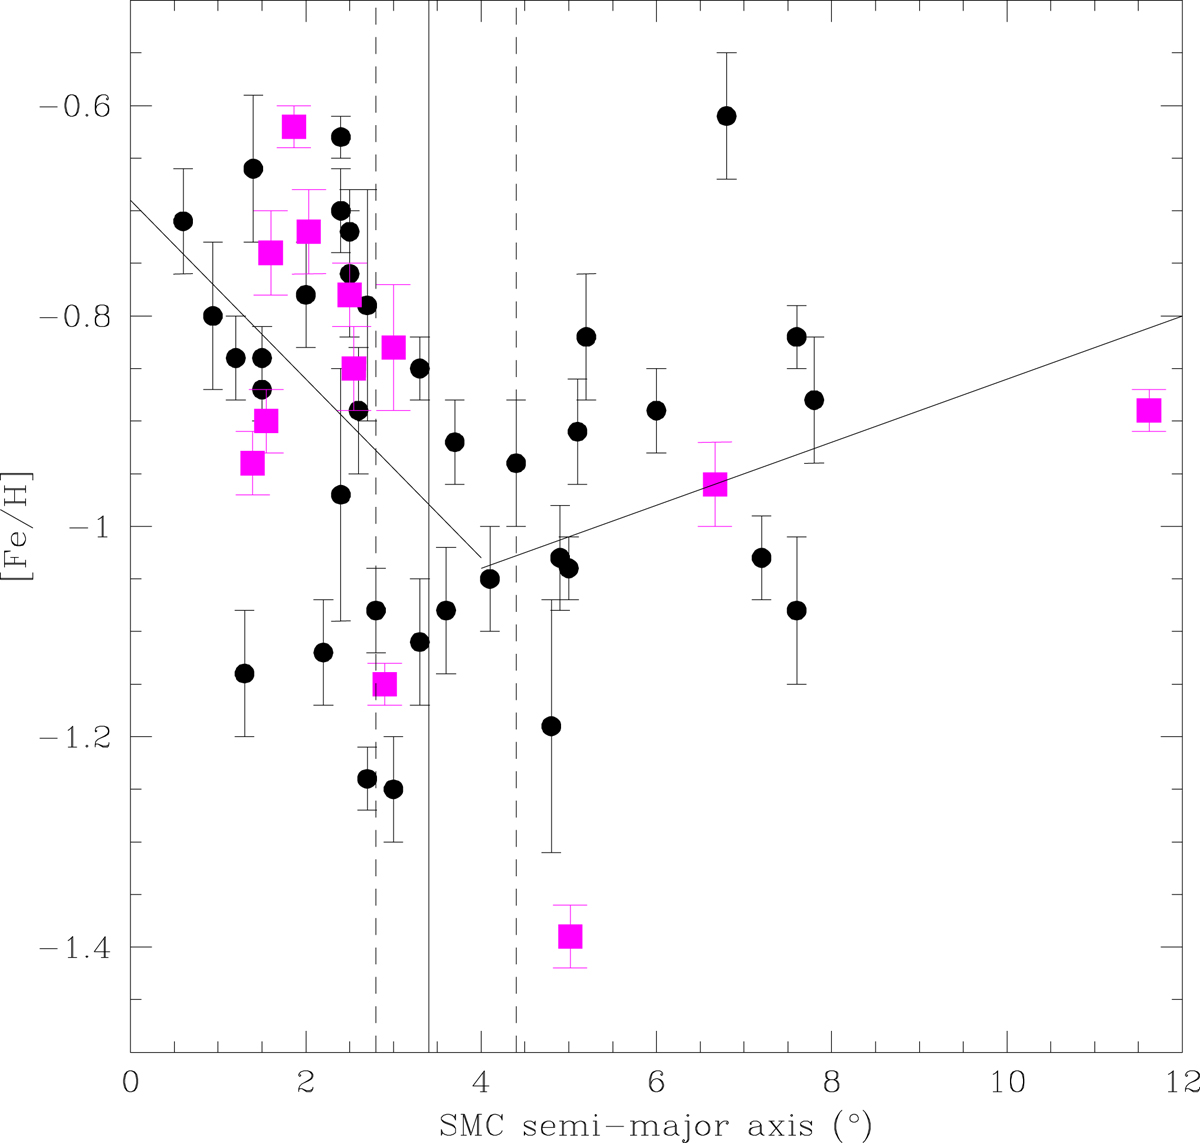
Fig. 10.
Download original image
Metallicity as a function of the semimajor axis, a, for the full cluster sample. Black circles are clusters taken from the literature (Table 5) and pink squares are clusters studied in this work (Table 3). Vertical solid and dashed lines represent the SMC tidal radius and the errors from D21. The MG fits are shown for the inner and outer regions (solid lines).
Current usage metrics show cumulative count of Article Views (full-text article views including HTML views, PDF and ePub downloads, according to the available data) and Abstracts Views on Vision4Press platform.
Data correspond to usage on the plateform after 2015. The current usage metrics is available 48-96 hours after online publication and is updated daily on week days.
Initial download of the metrics may take a while.