Free Access
Fig. 9.
Download original image
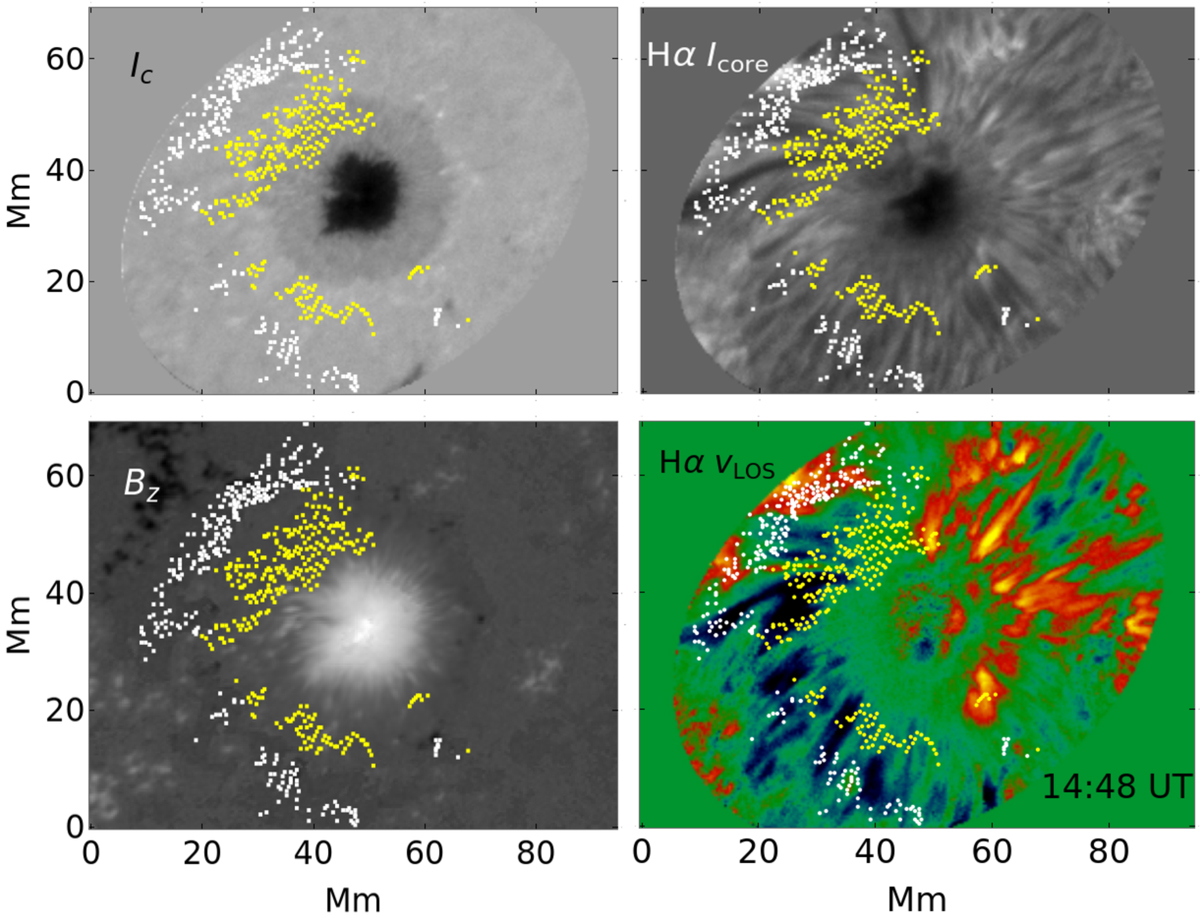
Locations of the inner and outer FPs of closed MFLs at 14:48 UT. The images in the background show (clockwise, starting left top) the Hα continuum and line-core intensity, the Hα LOS velocity, and Bz. Yellow (white) points denote the locations of the inner (outer) FPs.
Current usage metrics show cumulative count of Article Views (full-text article views including HTML views, PDF and ePub downloads, according to the available data) and Abstracts Views on Vision4Press platform.
Data correspond to usage on the plateform after 2015. The current usage metrics is available 48-96 hours after online publication and is updated daily on week days.
Initial download of the metrics may take a while.