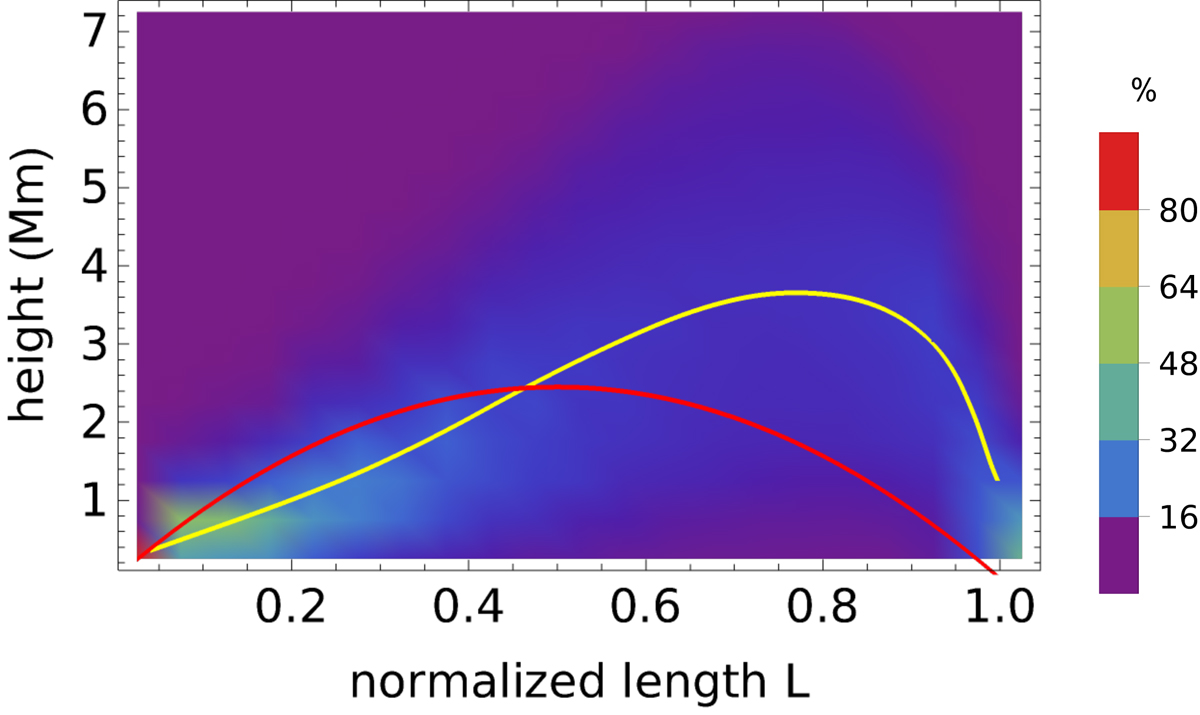
Fig. 7.
Download original image
Loop shape for closed MFLs in the large sample against relative 2D length L. The background image shows the probability distribution of the height with the color bar to the right. The inner (outer) FP is at L = 0 (1). The yellow line indicates the average, while the red line is a parabolic loop with an apex height of 2.45 Mm.
Current usage metrics show cumulative count of Article Views (full-text article views including HTML views, PDF and ePub downloads, according to the available data) and Abstracts Views on Vision4Press platform.
Data correspond to usage on the plateform after 2015. The current usage metrics is available 48-96 hours after online publication and is updated daily on week days.
Initial download of the metrics may take a while.