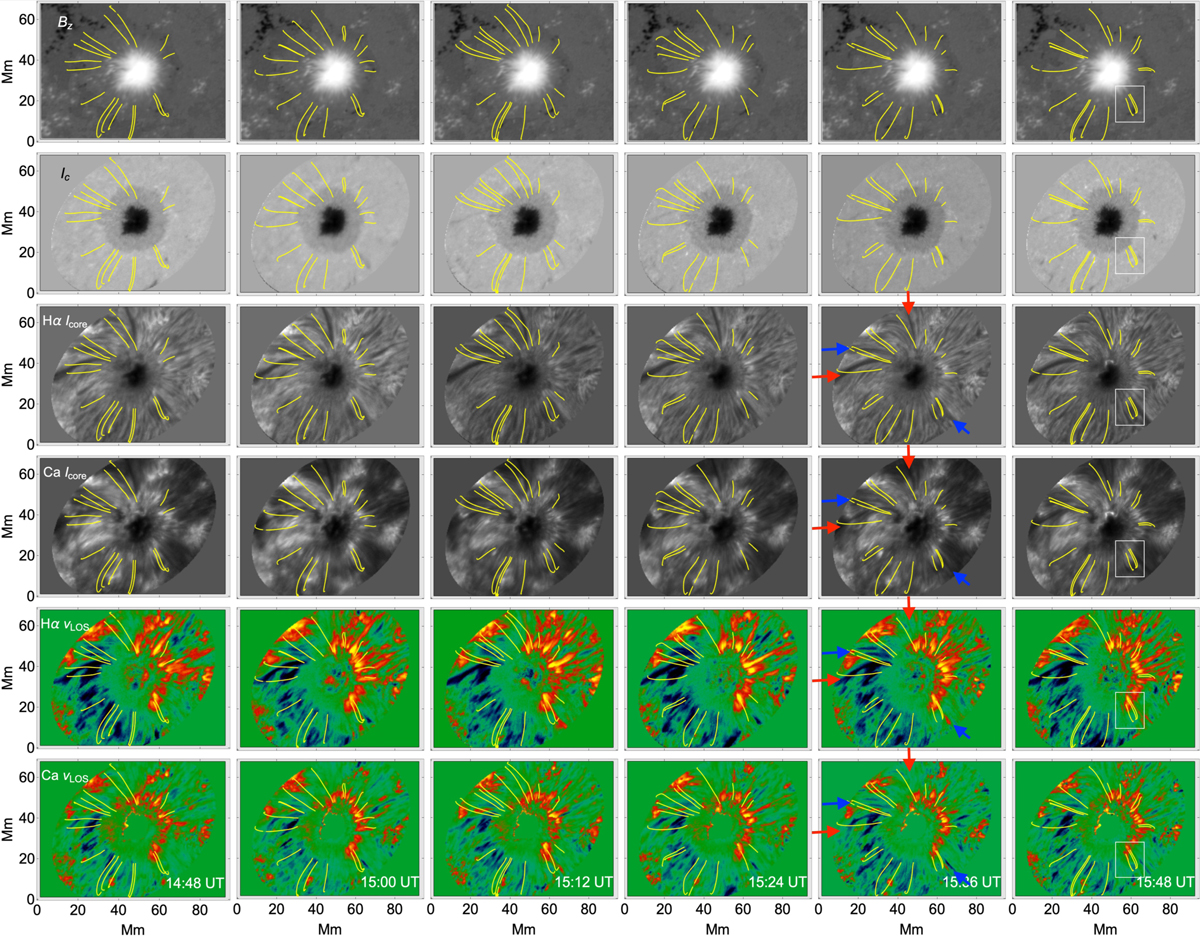
Fig. 4.
Download original image
Magnetic field lines of all manually selected IEF channels. Left to right: at 14:48 to 15:48 UT in steps of 12 min. The background images are from top to bottom Bz, Hα and Ca II IR continuum intensity, Hα line-core intensity, Hα LOS velocity and Ca II IR LOS velocity. The white rectangle in the rightmost column indicates the location of the “perfect” IEF channel shown in Fig. 24 below. The red and blue arrows in the fifth column mark Hα filaments.
Current usage metrics show cumulative count of Article Views (full-text article views including HTML views, PDF and ePub downloads, according to the available data) and Abstracts Views on Vision4Press platform.
Data correspond to usage on the plateform after 2015. The current usage metrics is available 48-96 hours after online publication and is updated daily on week days.
Initial download of the metrics may take a while.