Free Access
Fig. B.1.
Download original image
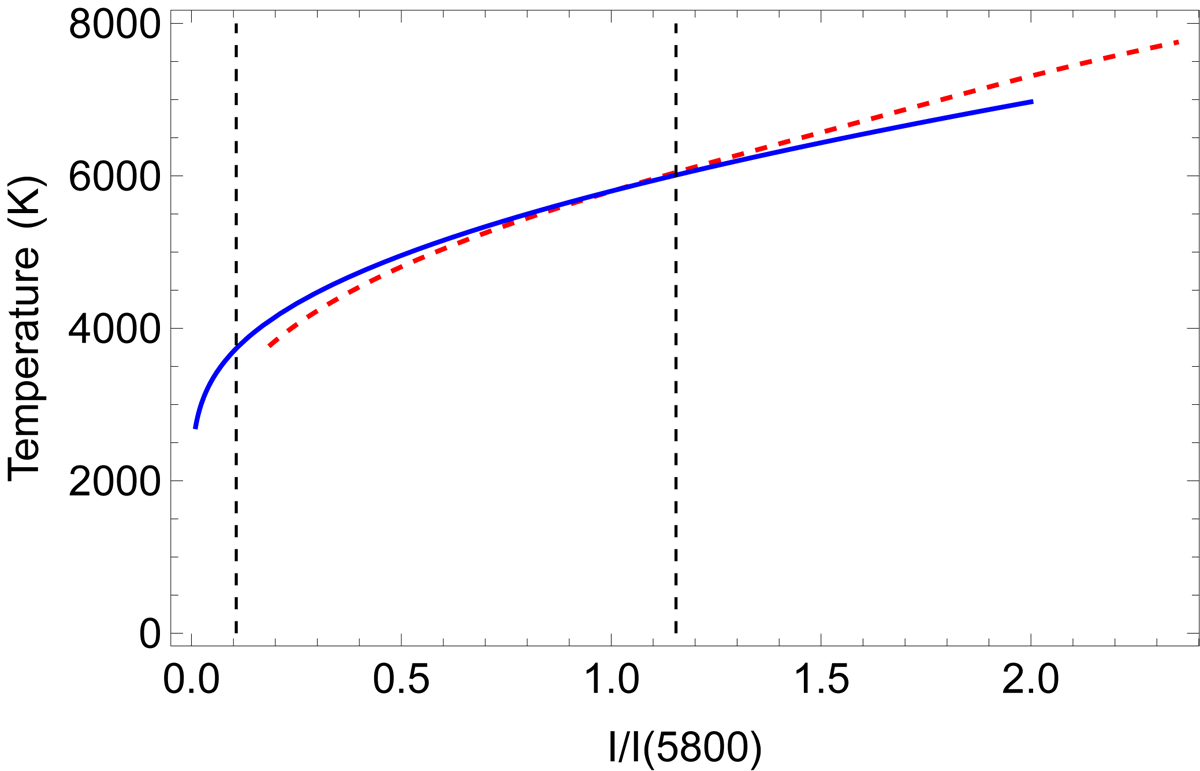
Conversion curves between HMI continuum intensity and temperature as derived from the Planck function (blue line) and using the SIR code (red dashed line). The black dashed vertical lines at I/I(5800) = 0.11 and 1.15 represent the minimum and maximum intensity values in our HMI data.
Current usage metrics show cumulative count of Article Views (full-text article views including HTML views, PDF and ePub downloads, according to the available data) and Abstracts Views on Vision4Press platform.
Data correspond to usage on the plateform after 2015. The current usage metrics is available 48-96 hours after online publication and is updated daily on week days.
Initial download of the metrics may take a while.