Free Access
Fig. A.1.
Download original image
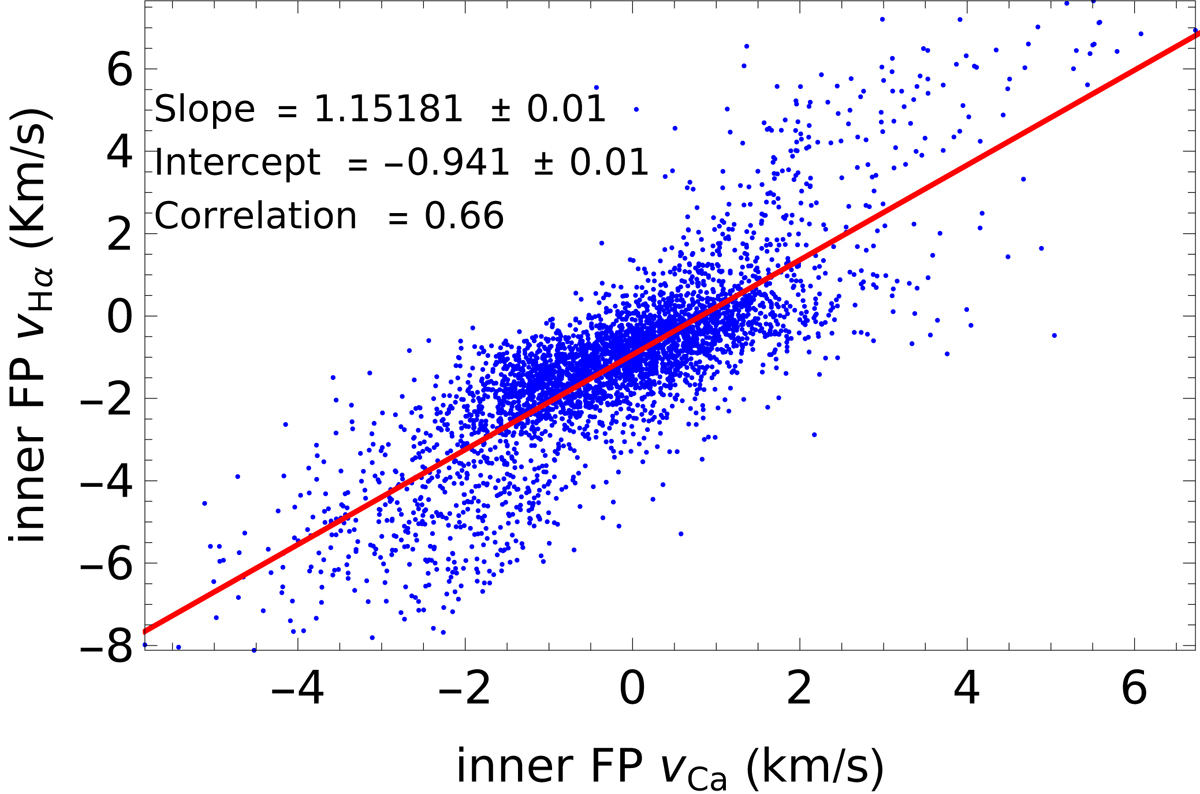
Scatter plot of the LOS velocities of Hα and Ca II IR at the inner FPs of closed MFLs near the outer penumbral boundary. The red line shows a linear regression to the data points. Its slope and intercept, and the linear correlation coefficient are given inside the panel. Only every fifth data point is plotted.
Current usage metrics show cumulative count of Article Views (full-text article views including HTML views, PDF and ePub downloads, according to the available data) and Abstracts Views on Vision4Press platform.
Data correspond to usage on the plateform after 2015. The current usage metrics is available 48-96 hours after online publication and is updated daily on week days.
Initial download of the metrics may take a while.