Fig. 24.
Download original image
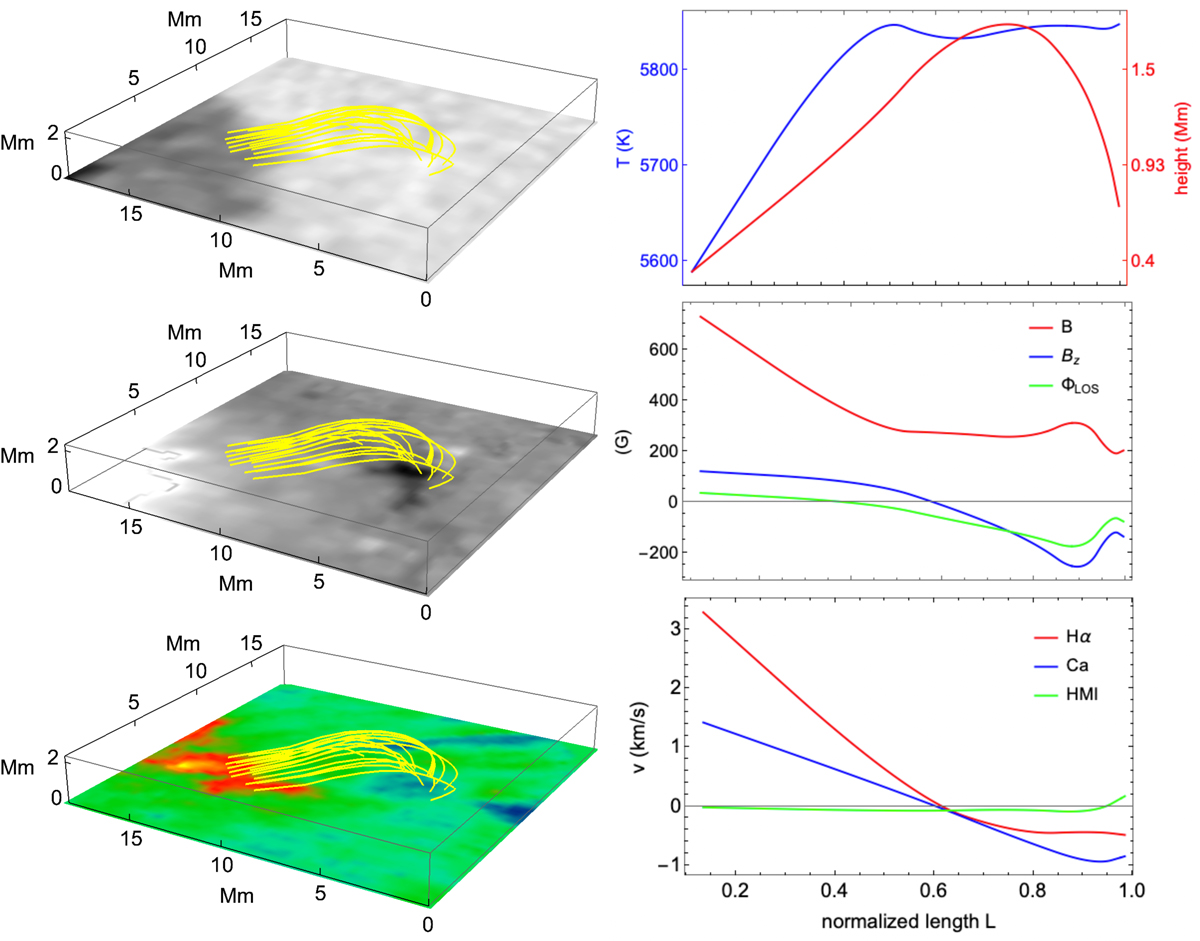
The “perfect” IEF channel south of the sunspot. Left column: 3D view of the MFLs connecting the sunspot to the opposite-polarity patch on top of the continuum intensity Ic (top panel), Bz (middle panel), and the Ca II IR LOS velocity (bottom panel). Right column: different quantities averaged over the MFLs in the left column as a function of the relative length L. Top panel: temperature (blue line, y-axis at the left) and height (red line, y-axis at the right). Middle panel: LOS magnetic flux ΦLOS (green line), Bz (blue line) and field strength B (red line). Bottom panel: LOS velocities of HMI (green line), Ca II IR (blue line), and Hα (red line).
Current usage metrics show cumulative count of Article Views (full-text article views including HTML views, PDF and ePub downloads, according to the available data) and Abstracts Views on Vision4Press platform.
Data correspond to usage on the plateform after 2015. The current usage metrics is available 48-96 hours after online publication and is updated daily on week days.
Initial download of the metrics may take a while.