Fig. 23.
Download original image
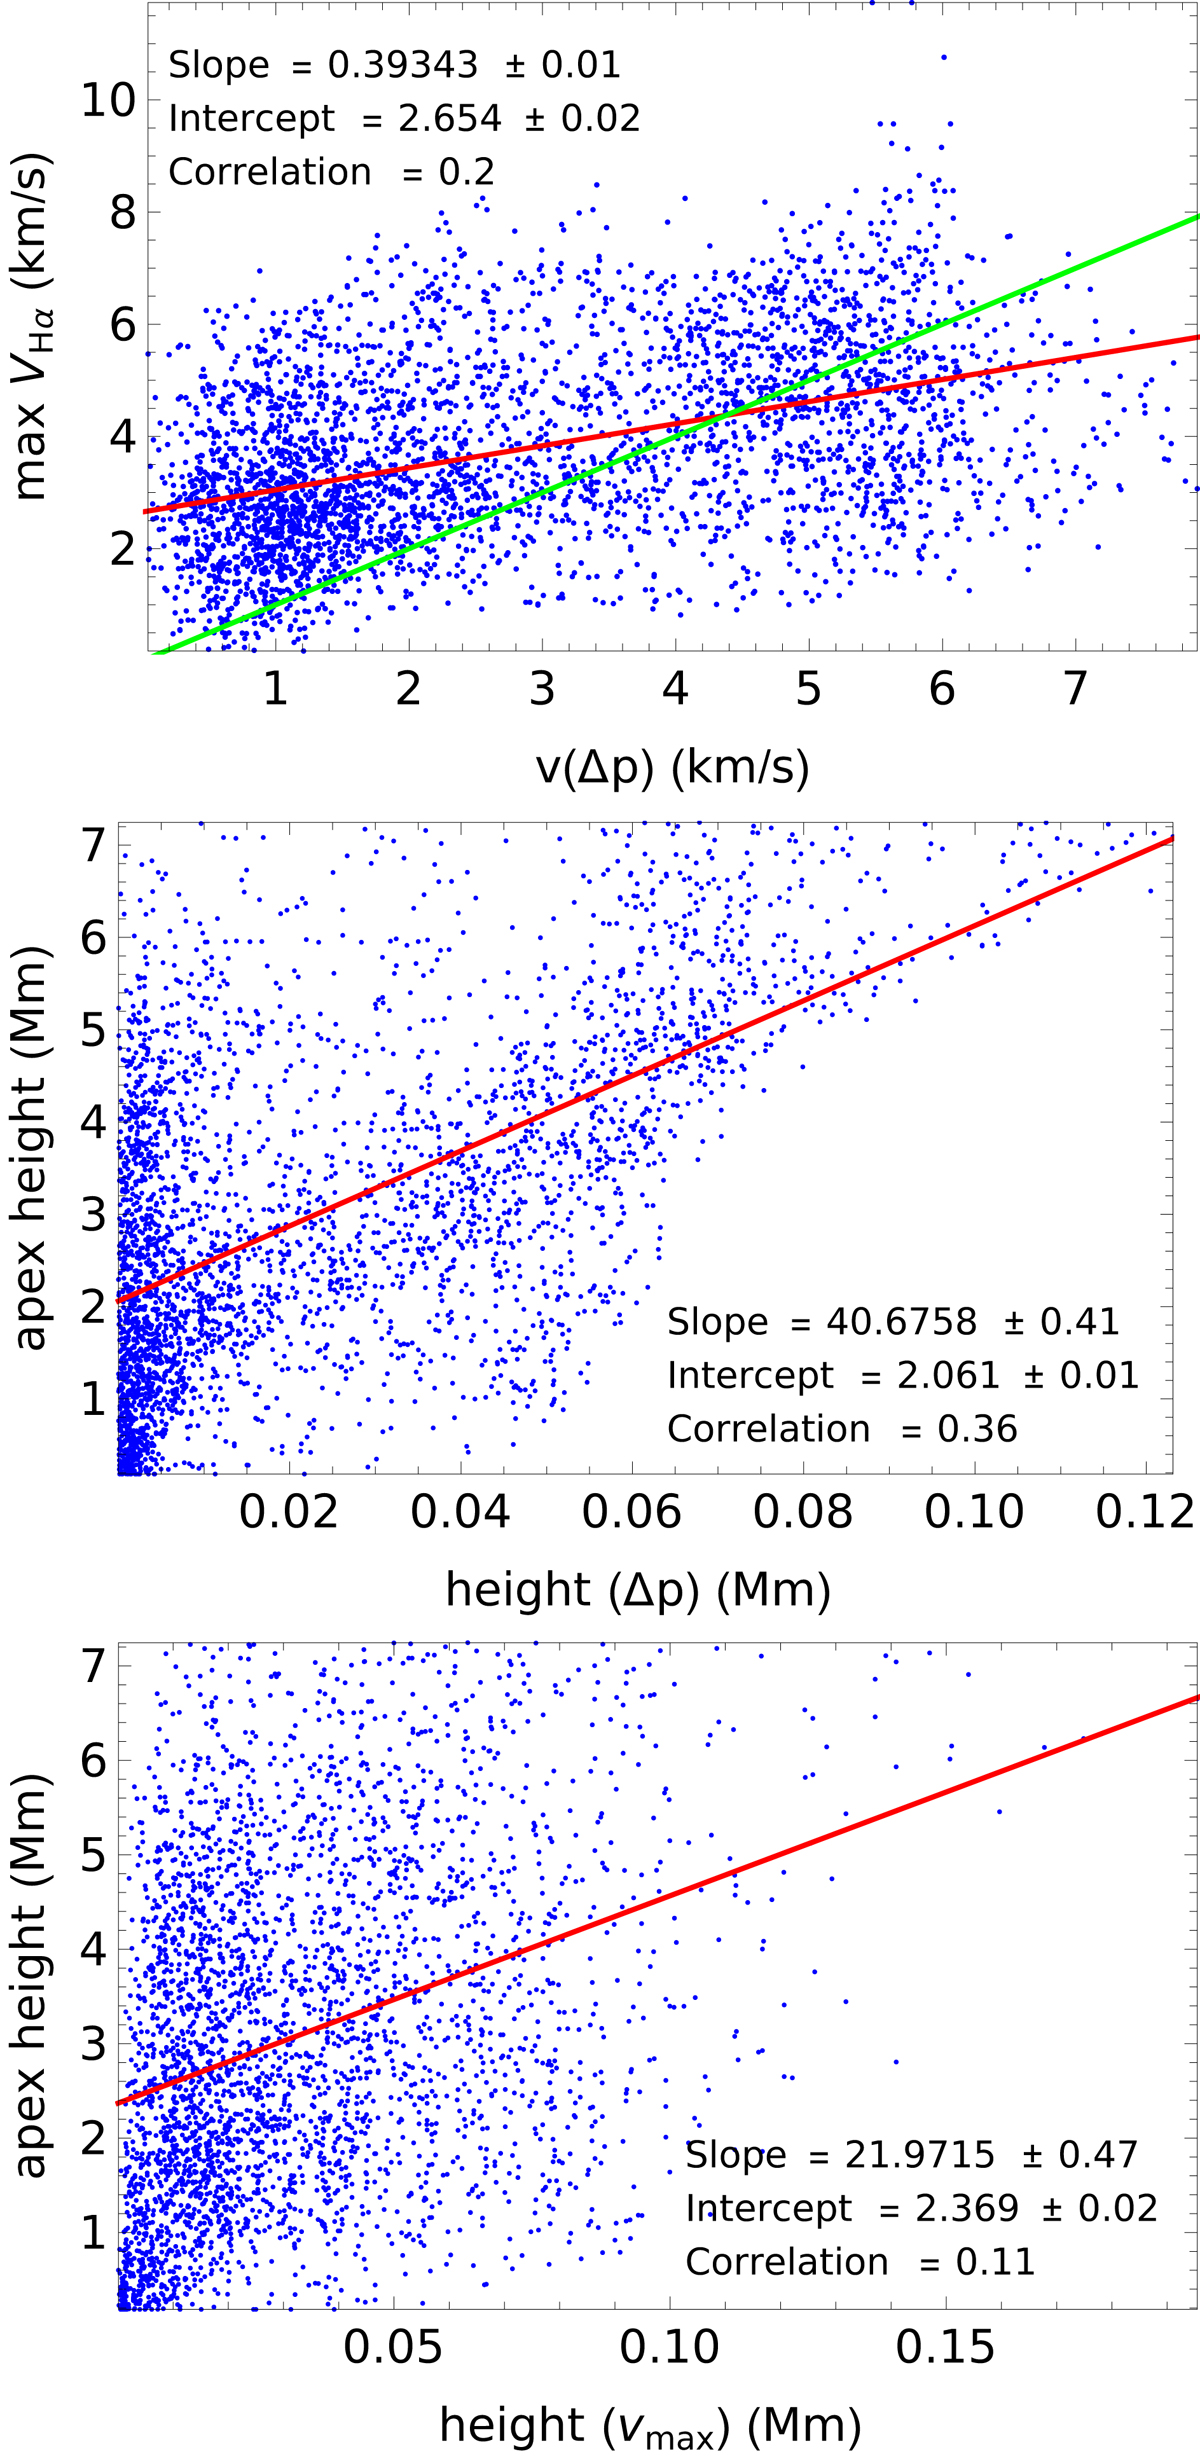
Scatter plots of predicted and measured velocities and apex heights. Top to bottom: predicted vs. observed maximal Hα LOS velocity, measured apex height vs. prediction from Δpeff, and measured apex height vs. prediction from the observed maximal Hα LOS velocity. The green line in the top panel indicates a one-to-one correlation.
Current usage metrics show cumulative count of Article Views (full-text article views including HTML views, PDF and ePub downloads, according to the available data) and Abstracts Views on Vision4Press platform.
Data correspond to usage on the plateform after 2015. The current usage metrics is available 48-96 hours after online publication and is updated daily on week days.
Initial download of the metrics may take a while.