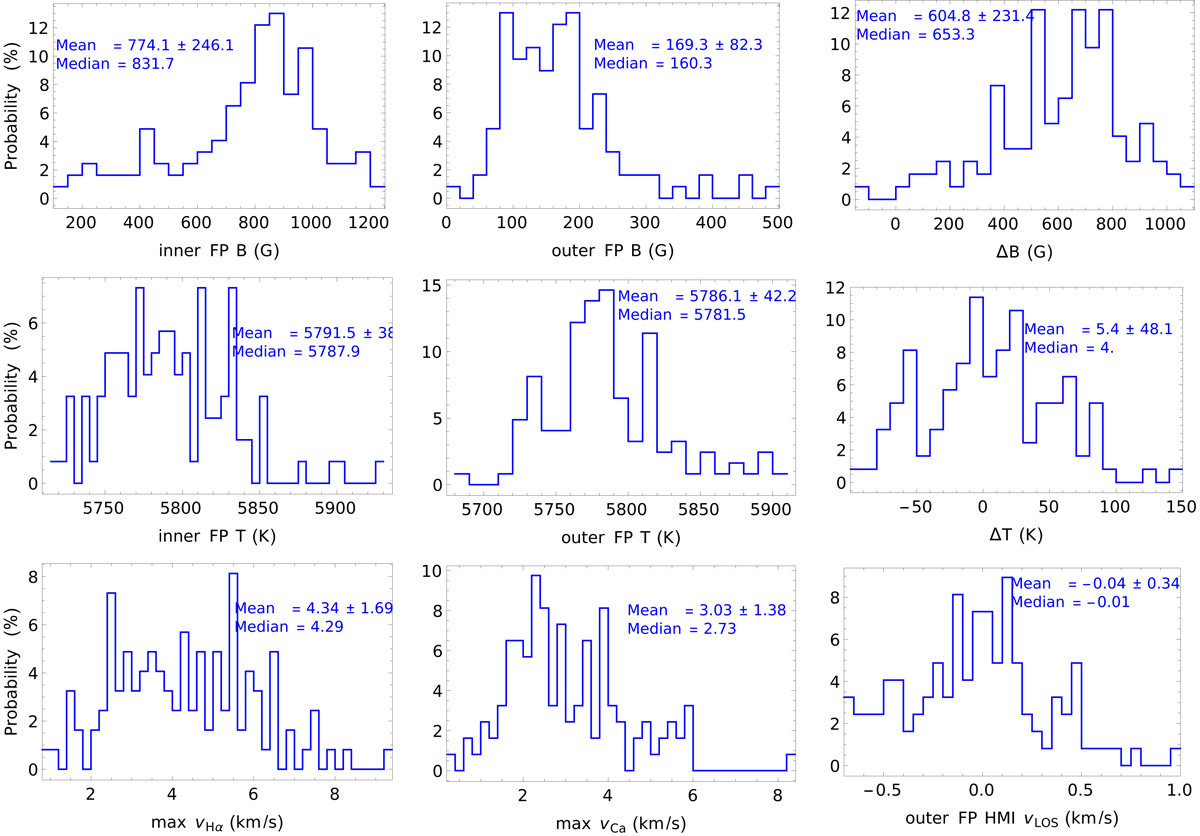
Fig. 21.
Download original image
Histograms of physical properties of the manually selected IEF channels. Top two rows: histograms of B and T at the inner (left column) and outer (middle column) FPs and their differences ΔB and ΔT (right column). Bottom row, left to right: histograms of maximal chromospheric LOS velocities in Hα and Ca II IR and photospheric HMI velocity at the outer FPs.
Current usage metrics show cumulative count of Article Views (full-text article views including HTML views, PDF and ePub downloads, according to the available data) and Abstracts Views on Vision4Press platform.
Data correspond to usage on the plateform after 2015. The current usage metrics is available 48-96 hours after online publication and is updated daily on week days.
Initial download of the metrics may take a while.