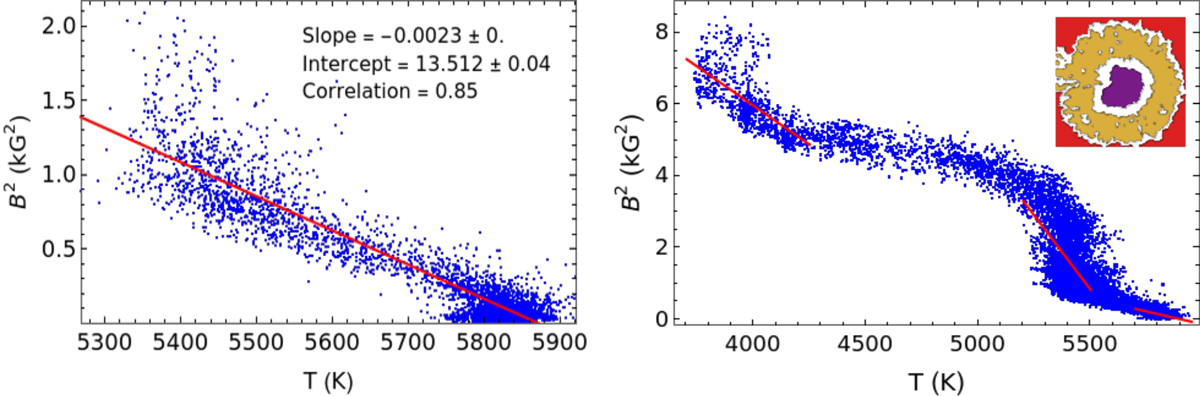
Fig. 20.
Download original image
Scatter plots of the relation between T and B2. Left panel: for the inner FPs of the large sample. Right panel: For a square covering the whole sunspot and some QS regions in all six time steps. The red lines are straight line fits to all or subsets of data points. The inset in the upper right corner of the right panel shows the corresponding spatial mask for the umbra (purple), penumbra (orange), and QS (red) at 14:48 UT.
Current usage metrics show cumulative count of Article Views (full-text article views including HTML views, PDF and ePub downloads, according to the available data) and Abstracts Views on Vision4Press platform.
Data correspond to usage on the plateform after 2015. The current usage metrics is available 48-96 hours after online publication and is updated daily on week days.
Initial download of the metrics may take a while.