Fig. 12.
Download original image
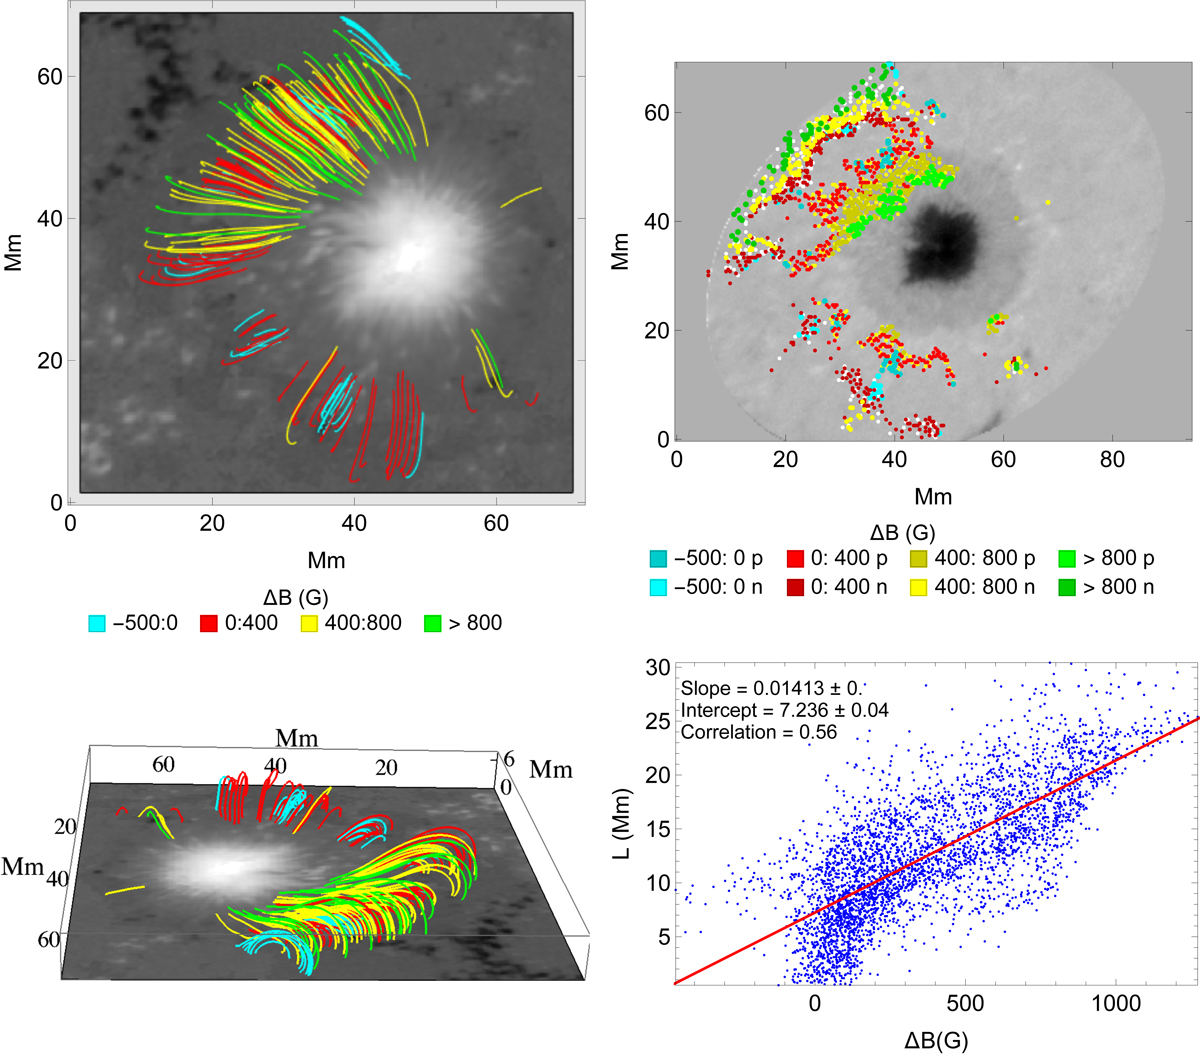
Properties of MFLs with different ΔB. Top left: field lines with ΔB < 0 G (turquoise), 0–400 G (red), 400–800 G (yellow), and > 800 G (green) in a top view overlaid on Bz. Bottom left: same in a side view to highlight the shape. Top right: inner and outer FPs for the same ranges in ΔB. Bottom right: scatter plot of ΔB and 3D loop length. The map in the bottom left panel is rotated relative to the images in the top row for better visibility of the closed MFLs.
Current usage metrics show cumulative count of Article Views (full-text article views including HTML views, PDF and ePub downloads, according to the available data) and Abstracts Views on Vision4Press platform.
Data correspond to usage on the plateform after 2015. The current usage metrics is available 48-96 hours after online publication and is updated daily on week days.
Initial download of the metrics may take a while.