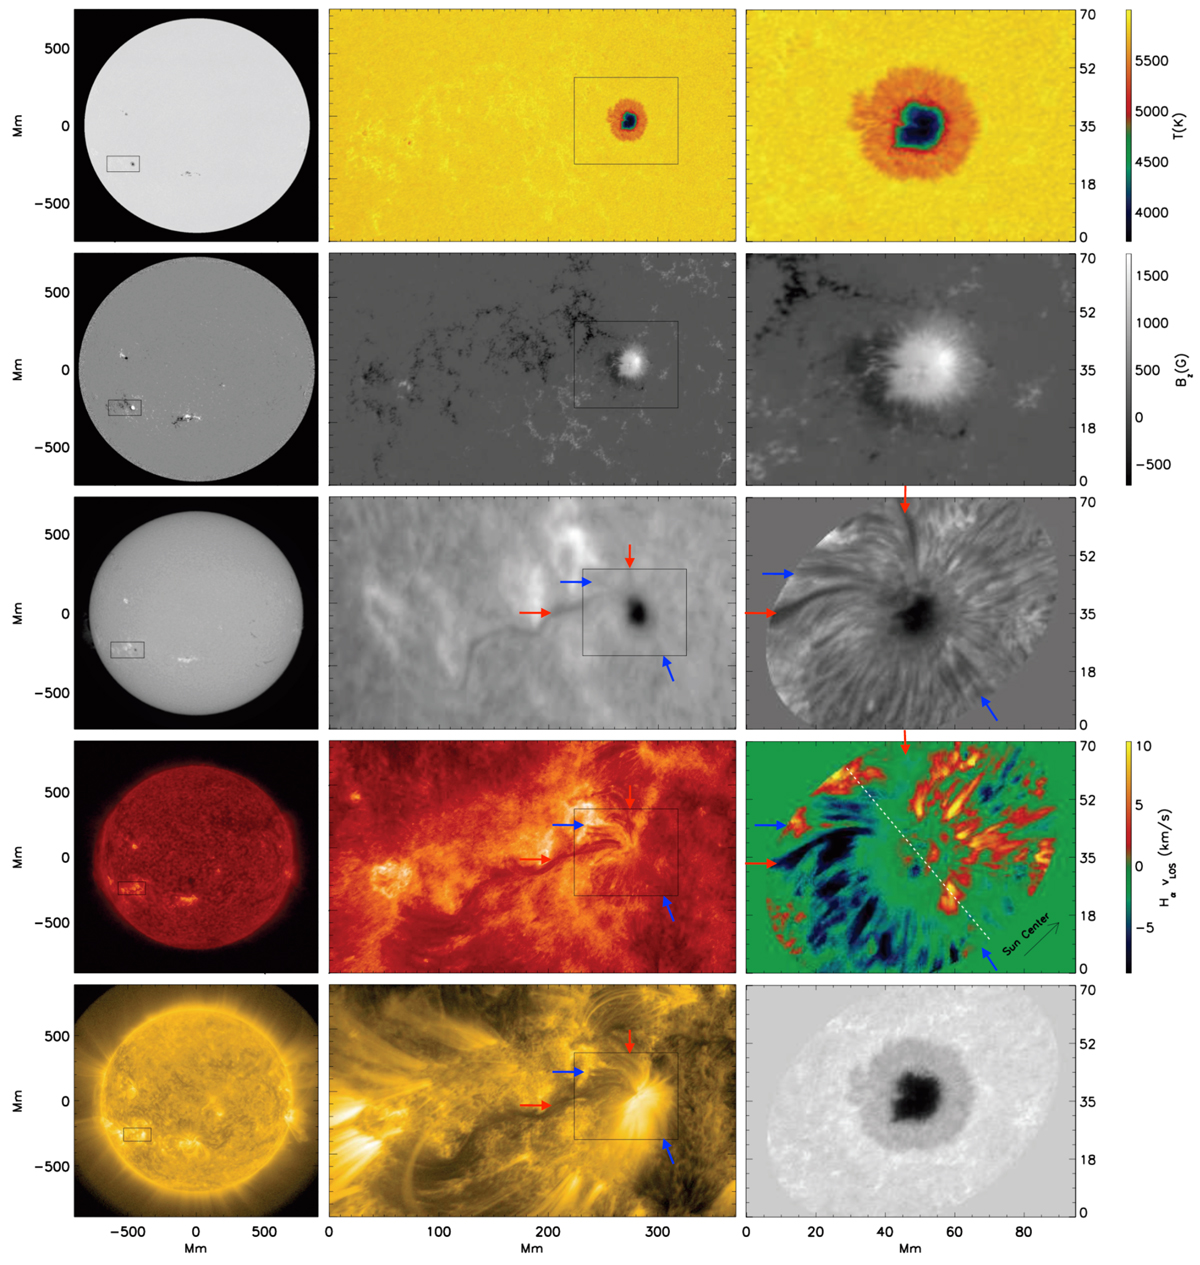
Fig. 1.
Download original image
Overview figure showing the location of AR NOAA 12418 on 16 September 2015. Left column, top to bottom: Full-disk images in HMI Ic, Bz, GONG Hα, AIA 304 Å, and AIA 171 Å. Middle column: magnification of the black rectangle (371 Mm × 186 Mm) in the left column. The HMI Ic has been exchanged for the derived temperature instead. Right column: magnification of the black rectangle marked in the middle column (94 Mm × 70 Mm). Lower three panels: Hα line-core intensity and velocity, and the continuum intensity from the IBIS high-resolution spectra. The white dashed line in the Hα velocity map marks the symmetry line of the sunspot. The GONG Hα image in the middle column is not de-projected in contrast to all other panels in the right two columns. The red and blue arrows mark examples of Hα filaments as opposite to IEF channels.
Current usage metrics show cumulative count of Article Views (full-text article views including HTML views, PDF and ePub downloads, according to the available data) and Abstracts Views on Vision4Press platform.
Data correspond to usage on the plateform after 2015. The current usage metrics is available 48-96 hours after online publication and is updated daily on week days.
Initial download of the metrics may take a while.