Free Access
Fig. 7.
Download original image
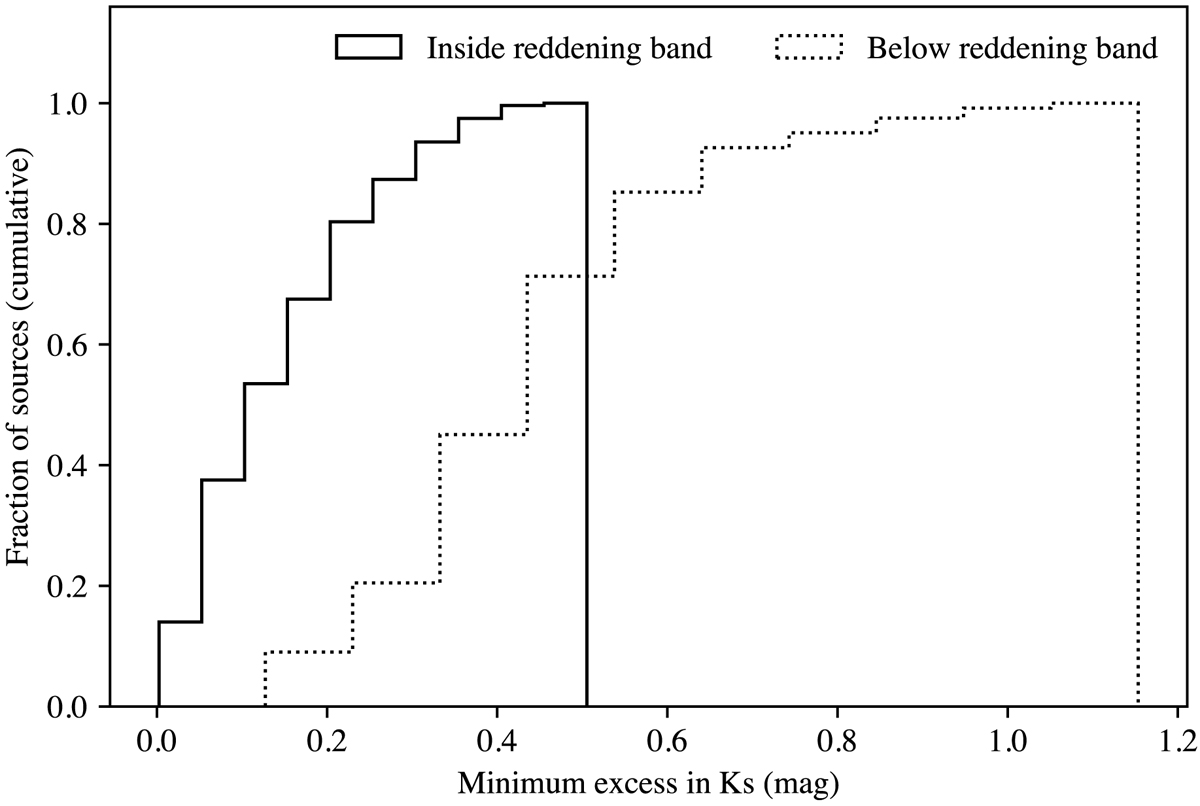
Cumulative distribution of the minimum excess in KS (|eK|) required to find consistent colors and magnitudes for the sources whose colors lie inside the reddening band (solid line) and for those whose colors fall below the reddening band (dotted line).
Current usage metrics show cumulative count of Article Views (full-text article views including HTML views, PDF and ePub downloads, according to the available data) and Abstracts Views on Vision4Press platform.
Data correspond to usage on the plateform after 2015. The current usage metrics is available 48-96 hours after online publication and is updated daily on week days.
Initial download of the metrics may take a while.