Fig. 8.
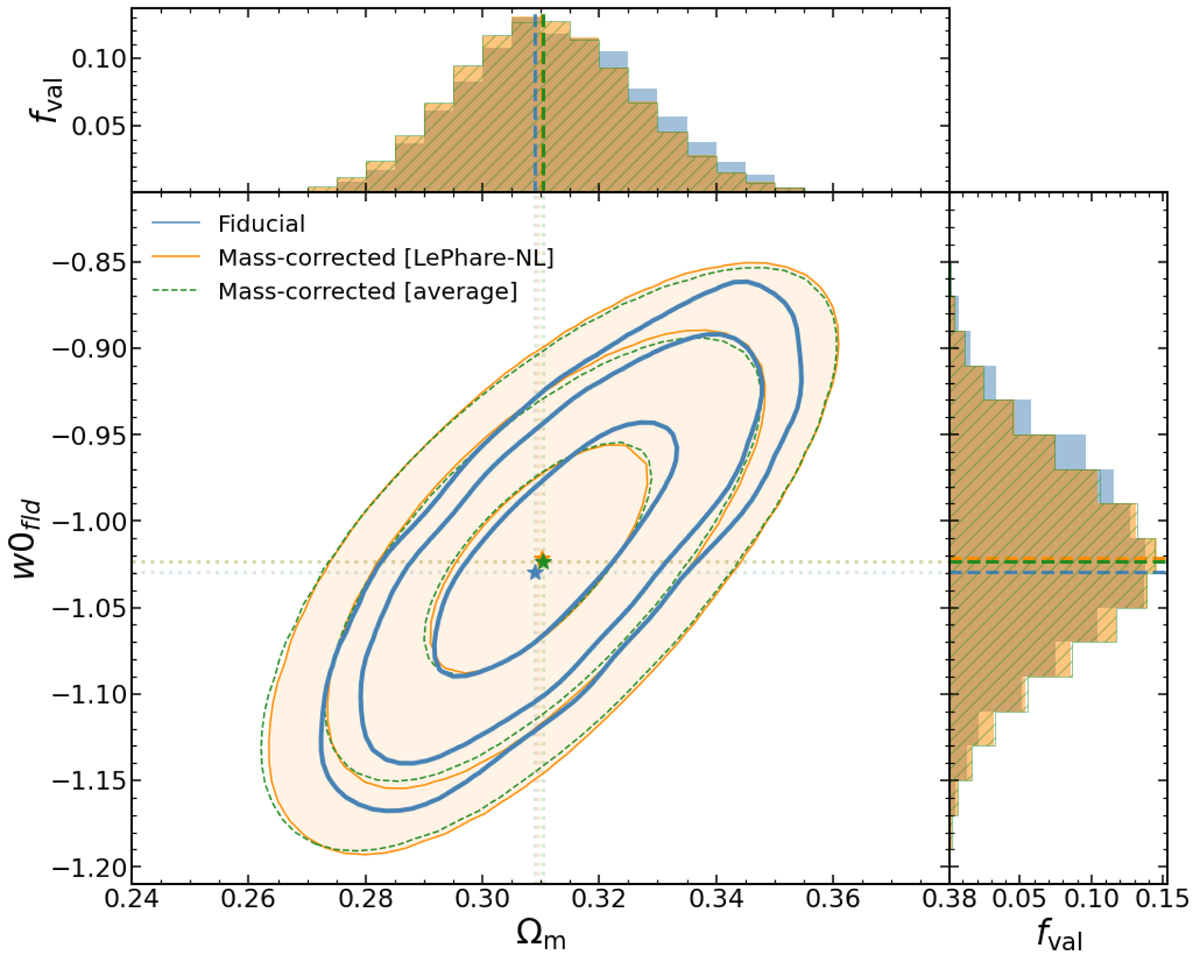
Download original image
Resulting posterior distributions on ω and Ωm for different stellar mass corrections (LEPHARE-NL stellar mass correction in orange and average stellar mass correction in green) compared to the fit using the original stellar masses from Betoule et al. (2014) in blue. The contour levels correspond, from inside out, to 68%, 95%, and 99% of the posterior distribution. We show as stars (same colours as contours) the best-fit value for each configuration. Vertical and horizontal lines indicate the best-fit value of each parameter for the three different setups. There is no significant difference on the constraints when using the mass-corrected dataset with respect to the fiducial model. We find small differences in the best-fit values (star symbols), with the LEPHARE-NL stellar mass correction configuration showing the largest difference with respect to the fiducial model.
Current usage metrics show cumulative count of Article Views (full-text article views including HTML views, PDF and ePub downloads, according to the available data) and Abstracts Views on Vision4Press platform.
Data correspond to usage on the plateform after 2015. The current usage metrics is available 48-96 hours after online publication and is updated daily on week days.
Initial download of the metrics may take a while.