Fig. 7.
Download original image
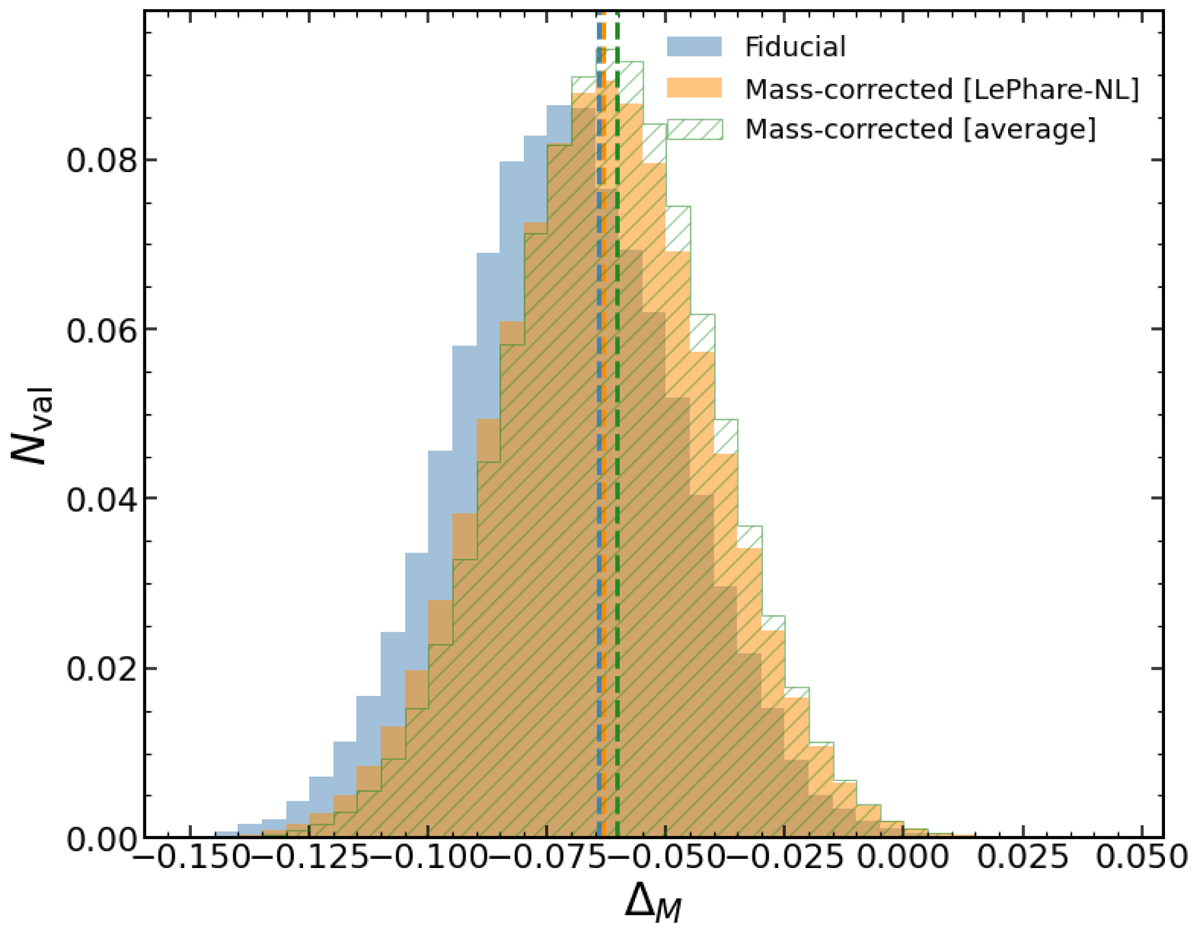
Resulting posterior distributions on ΔM for different runs. We show the LEPHARE-NL stellar mass correction results in orange and average stellar mass correction results in green, compared to the fit using the original stellar masses from Betoule et al. (2014). Vertical lines indicate the best-fit value for each configuration. We find that the fiducial model has a slightly larger value for ΔM than either of the mass-corrected models, being very close to the best-fit value for the LEPHARE-NL correction model. Nevertheless, the resulting distributions for both mass-corrected models are similar.
Current usage metrics show cumulative count of Article Views (full-text article views including HTML views, PDF and ePub downloads, according to the available data) and Abstracts Views on Vision4Press platform.
Data correspond to usage on the plateform after 2015. The current usage metrics is available 48-96 hours after online publication and is updated daily on week days.
Initial download of the metrics may take a while.