Fig. 6.
Download original image
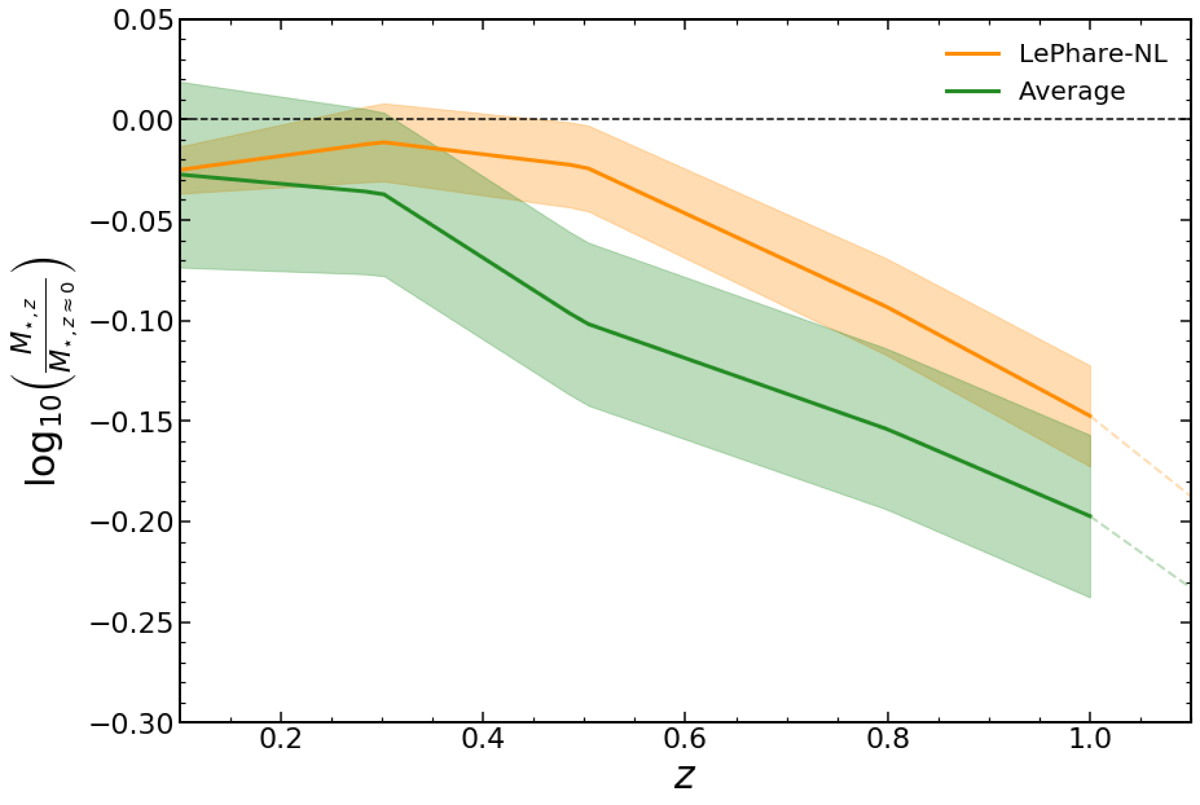
Mass correction function for each redshift to be applied to the estimated observed stellar masses. The orange line represents the global mass correction using our best approximation (LEPHARE [no-lines]). The green line shows the correction to be applied using the weighted average correction derived from all SED-fitting codes. The shaded regions represent the uncertainty on the correction at each redshift.
Current usage metrics show cumulative count of Article Views (full-text article views including HTML views, PDF and ePub downloads, according to the available data) and Abstracts Views on Vision4Press platform.
Data correspond to usage on the plateform after 2015. The current usage metrics is available 48-96 hours after online publication and is updated daily on week days.
Initial download of the metrics may take a while.