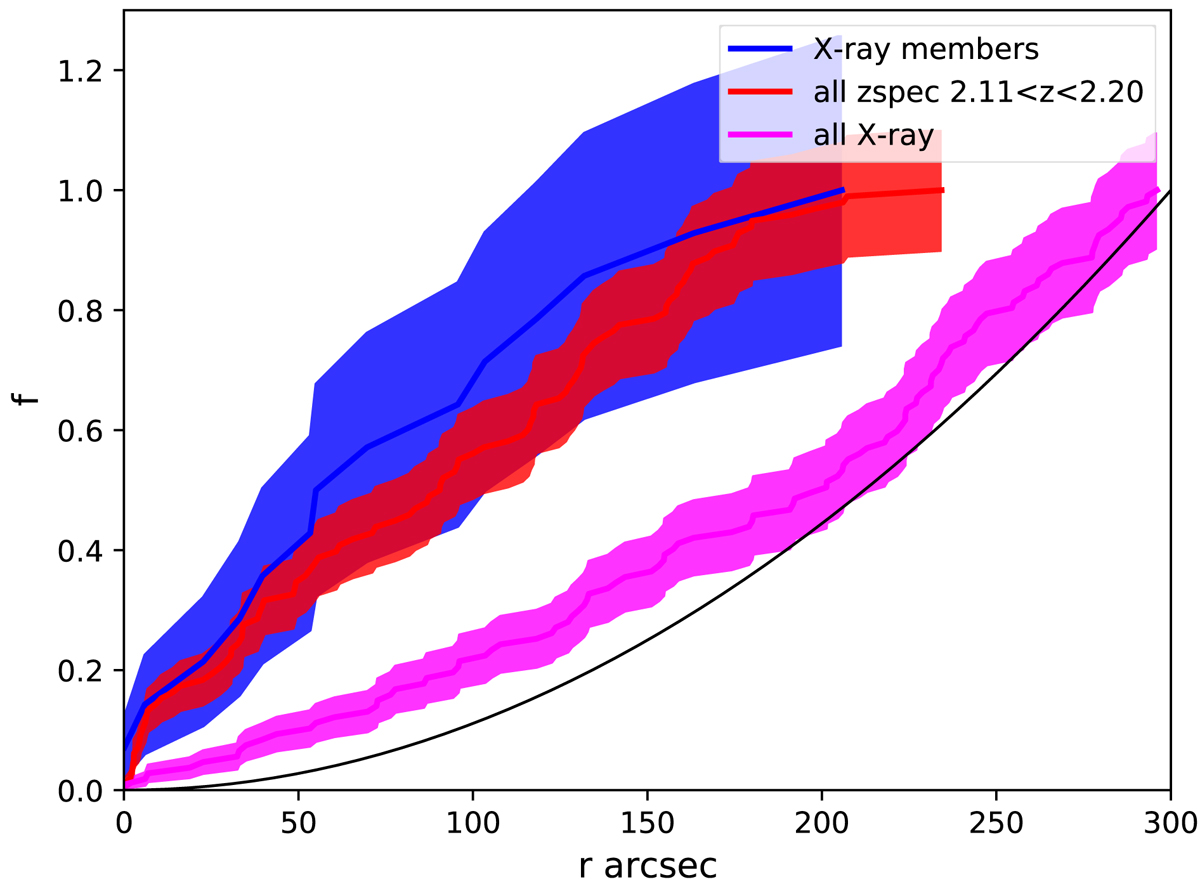
Fig. 9.
Download original image
Fraction of sources within a given radius from the Spiderweb Galaxy. X-ray cluster members (shown in blue) have the same distribution as all the spectroscopically confirmed protocluster members in the 2.11 < z < 2.20 range (shown in red). On the other hand, the distribution of all the X-ray sources (dominated by the field) is clearly less clustered. The thin black line shows a perfectly uniform source distribution. The shaded area corresponds to an uncertainty of 1σ.
Current usage metrics show cumulative count of Article Views (full-text article views including HTML views, PDF and ePub downloads, according to the available data) and Abstracts Views on Vision4Press platform.
Data correspond to usage on the plateform after 2015. The current usage metrics is available 48-96 hours after online publication and is updated daily on week days.
Initial download of the metrics may take a while.